
Infrastructure benchmarks may represent the same asset class, but differences in their composition can at times drive dramatically different performance outcomes.
KEY TAKEAWAYS
- Construction differences can lead to meaningful variations in performance, volatility and diversification characteristics.
- Short-term performance dispersion does not necessarily reflect long- term history or likely future outcomes.
- Active management can look beyond benchmark constraints in pursuit of improved risk-adjusted returns, relative to rules-based approaches.
Infrastructure benchmarks are often viewed as interchangeable measures of the asset class, yet their underlying methodologies can produce distinct exposures and outcomes. The FTSE Global Core Infrastructure 50/50 Index (FGCI), Dow Jones Brookfield Global Infrastructure Index (DJBGI) and S&P Global Infrastructure Index (SPGI)—the most commonly used diversified infrastructure benchmarks—each seek to represent the global infrastructure universe. But they do so using different methodologies for constituent selection, sector allocation and index construction.
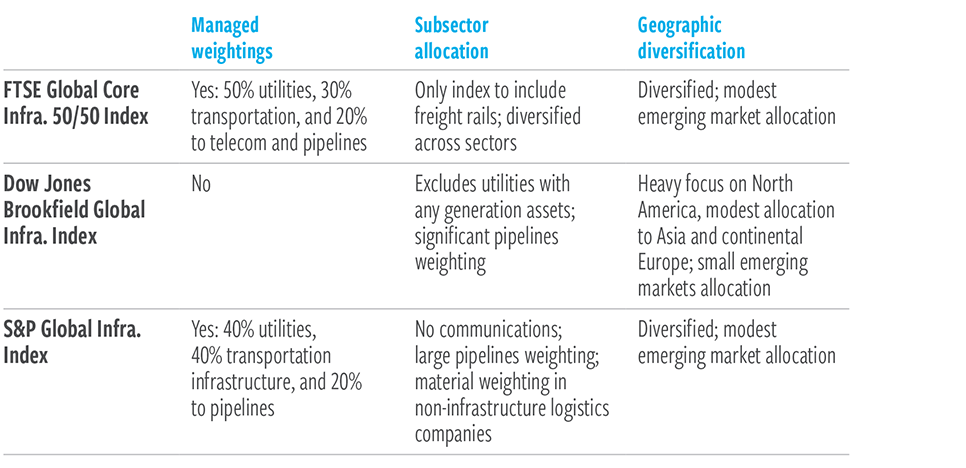
Exhibit 1 provides a snapshot comparison of the three benchmarks. The FGCI and SPGI both employ managed sector weightings but differ in their allocations and constituent selection. The FGCI offers broad infrastructure asset class exposure across utilities, transportation, telecommunications and pipelines, while the SPGI allocates more heavily to pipelines and excludes communications infrastructure. By contrast, the DJBGI uses market-cap weightings and includes only transmission- and distribution-focused utilities, resulting in greater midstream energy exposure, more limited utility exposure and a larger North American footprint.
EXHIBIT 1
Infrastructure benchmarks differ meaningfully in construction and exposure
Index Highlights
At June 30, 2026. Source: Cohen & Steers.
Index weightings, allocations and geographic diversification are subject to change without notice.
These methodological differences influence not only index composition but also investment characteristics. Variations in sector exposure, geographic diversification and constituent selection can lead to important differences in performance, volatility and downside participation across market environments, as shown in Exhibit 2.
Benchmarks with higher exposure to a particular sector or region may benefit when those areas are in favor but may lag when leadership shifts elsewhere. As a result, periods of short-term performance divergence among infrastructure benchmarks are driven less by the superiority of one or another design than by the structural choices embedded in each index. Understanding these differences is essential when evaluating benchmark- relative results, assessing risk characteristics, and determining which measure of the asset class best aligns with an investor’s objectives.
EXHIBIT 2
Benchmark construction can shape returns, volatility and downside risk
Index performance comparison

At June 30, 2026. Source: Cohen & Steers.
Past performance is no guarantee of future results. The information presented above does not reflect the performance of any fund or other account managed or serviced by Cohen & Steers, and there is no guarantee that investors will experience the type of performance reflected above. Common benchmark inception is December 31, 2009. Return reflects compound annualized return. Volatility reflects annualized standard deviation of monthly returns. Sharpe ratio is an indication of risk-adjusted performance, represented here by dividing the annualized total return by the standard deviation. Equity beta is a measure of the volatility of a security or a portfolio in comparison to the MSCI World Index. Down capture is a measure of an investment’s average relative performance in periods of negative returns for the MSCI World Index.
Short-term dispersion can obscure long-term patterns
Performance differences among infrastructure benchmarks are driven largely by index construction methodologies. Performance in any given period should be evaluated in the context of prevailing market conditions and underlying exposures, not treated as evidence of a superior structural benchmark design.
Exhibit 3 shows the last decade’s year-to-year shifts in index leadership, which underscore the value of evaluating benchmark outcomes across a full cycle rather than relying on short-term performance.
EXHIBIT 3
Benchmark leadership shifts as market conditions change
Annual Returns

As of June 30, 2026. Source: Cohen & Steers.
Past performance is no guarantee of future results. The information presented above does not reflect the performance of any fund or other account managed or serviced by Cohen & Steers, and there is no guarantee that investors will experience the type of performance reflected above.
The following examples illustrate how index composition influenced relative performance in individual years.
2015: Oil prices declined sharply during the year amid rising inventories, softer demand from emerging markets, and a stronger U.S. dollar. Market conditions were exacerbated by OPEC’s decision to maintain production levels, prioritizing market share over price support. The weakness in energy markets weighed heavily on pipeline companies, many of which posted substantial share price declines. The FGCI’s outperformance was driven in large part by its lower exposure to midstream energy, along with greater exposure to cell towers and freight railways.
2020: Covid and the resulting economic shutdowns affected infrastructure subsectors in different ways. Reduced airport and toll road traffic weighed less heavily on the FGCI, given its lower exposure to those sectors, while reduced exposure to midstream energy cushioned it against the sharp decline in oil prices. Meanwhile, social distancing and work-from-home policies increased demand for connectivity, benefiting towers, while economically driven transport activity favored freight rails. Both trends rewarded the FGCI’s greater exposure to these subsectors.
2025: Listed infrastructure delivered strong returns, supported by solid fundamentals, AI-driven capital spending and declining interest rates. The SPGI’s outperformance came primarily from airports and electric utilities. SPGI’s greater exposure to Mexican airports benefited from robust passenger traffic; additionally, the index had no weighting in a Thai airport operator that experienced a sharp decline. The SPGI also benefited from several strong-performing renewable-tilted European electric utilities as well as two U.S.-based independent power producers not represented in the other indexes. Conversely, the SPGI had no exposure to towers or the North American freight rail subsector, which were relative laggards.
More broadly, the S&P Global Infrastructure Index has been advantaged by greater exposure to areas of the market that investors have favored in recent years. But the SPGI’s outperformance relative to its peers has come with tradeoffs in several attributes investors typically value in infrastructure assets. The FGCI and DJBGI indexes exhibited lower volatility, lower equity market beta, and lower downside capture relative to the broad equity market, while also generating stronger risk-adjusted returns, as measured by Sharpe ratio.
Active management can look beyond benchmark limitations
While each of the three benchmarks is viable for infrastructure investors (and we manage portfolios against all three on behalf of our clients), we believe FTSE best represents the asset class from a performance, diversification and risk perspective. It includes nearly all subsectors we consider infrastructure while excluding peripheral segments found in other indexes.
Regardless of which index an investor favors, we believe it is also important to weigh the pros and cons of active and passive investment approaches. Passive infrastructure strategies may offer transparency and low-cost access to the asset class, but they are ultimately constrained by the rules of their underlying indexes. As a result, investors inherit not only a benchmark’s infrastructure exposure but also its embedded biases, concentrations and methodology-driven limitations. Because passive portfolios must maintain benchmark-prescribed exposures, they have limited ability to adjust as market conditions, valuations and company fundamentals evolve.
Active managers have the flexibility to look beyond index construction methodologies and allocate capital where they see the most attractive risk- adjusted potential. This may include emphasizing sectors, geographies or companies that are underrepresented in major benchmarks, while reducing exposure to areas where valuations or fundamentals appear less compelling. Active managers can also incorporate forward-looking views on regulation, capital investment cycles and technological change, while using fundamental research and portfolio construction to manage concentrations and downside risks. Over a full market cycle, this flexibility may improve risk-adjusted outcomes and help identify opportunities and risks that a rules-based approach may overlook.
Important disclosures
An investor cannot invest directly in an index, and index performance does not reflect the deduction of any fees, expenses or taxes. Index comparisons have limitations, as volatility and other characteristics may differ from a particular investment.
Data quoted represents past performance, which is no guarantee of future results. This material is for informational purposes and reflects prevailing conditions and our judgment as of this date, which are subject to change. There is no guarantee that any market forecast set forth in this presentation will be realized. This material represents an assessment of the market environment at a specific point in time and should not be relied upon as investment advice, does not constitute a recommendation to buy or sell a security or other investment, and is not intended to predict or depict the performance of any investment. This material is not being provided in a fiduciary capacity and is not intended to recommend any investment policy or investment strategy or to take into account the specific objectives or circumstances of any investor. We consider the information in this presentation to be accurate, but we do not represent that it is complete or should be relied upon as the sole source of appropriateness for investment. Please consult with your investment, tax or legal professional regarding your individual circumstances prior to investing.
Risks of investing in global listed infrastructure: Infrastructure issuers may be subject to regulation by various governmental authorities and may also be affected by governmental regulation of rates charged to customers; operational or other mishaps; tariffs; and changes in tax laws, regulatory policies and accounting standards. Foreign securities involve special risks, including currency fluctuations, lower liquidity, political and economic uncertainties, and differences in accounting standards. Some international securities may represent small and medium-sized companies, which may be more susceptible to price volatility and may have lower liquidity than larger companies.
Cohen & Steers Capital Management, Inc. (Cohen & Steers) is a U.S. registered investment advisory firm that provides investment management services to corporate retirement, public and union retirement plans, endowments, foundations and mutual funds. Cohen & Steers Asia Limited is authorized and regulated by the Securities and Futures Commission of Hong Kong (ALZ367). Cohen & Steers Japan Limited is a registered financial instruments operator (investment advisory and agency business and discretionary investment management business with the Financial Services Agency of Japan and the Kanto Local Finance Bureau No. 3157) and is a member of the Japan Investment Advisers Association.
Cohen & Steers UK Limited is authorized and regulated by the Financial Conduct Authority (FRN458459). Cohen & Steers Ireland Limited is regulated by the Central Bank of Ireland (No.C188319). Cohen & Steers Singapore Private Limited is a private company limited by shares in the Republic of Singapore.
For recipients in the Middle East: This document is for informational purposes only. It does not constitute or form part of any marketing initiative or any offer to issue or sell (or any solicitation of any offer to subscribe or purchase) any products, strategies or other services, nor shall it or the fact of its distribution form the basis of, or be relied on in connection with, any contract resulting therefrom. In the event that the recipient of this document wishes to receive further information with regard to any products, strategies or other services, it shall specifically request the same in writing from us.