

As markets reach an inflection point, real assets stand out for their potential to diversify, protect against inflation and provide solid returns.
KEY TAKEAWAYS
- Avoid the hindsight trap in portfolio allocations
FOMO (fear of missing out) all too often plays an element in portfolio construction. But focusing on what worked well in the past can be a recipe for disappointment. We anticipate material headwinds for the winners of the recent past. - Asset allocators are facing a historical inflection point
Equity markets increasingly depend on the fates of a handful of stocks, valuations are unappealing, and inflation risks could leave stock/bond correlations near 50-year highs. By contrast, return expectations in the new regime favor real assets. - Real assets offer investors distinctive portfolio benefits
Both history and recent experience attest to the distinctive diversification potential and inflation sensitivity of real assets. We believe the beneficial attributes of real assets warrant a strategic allocation in every portfolio.
Avoid the hindsight trap in portfolio allocations
We have fielded many questions about the role of real assets in portfolios and have often heard narratives about a preference for broad equities and private assets, driven in part by recent experience. We believe such thinking could have a material adverse impact on portfolio returns in the years ahead. Research shows that asset allocation is a dominant driver of returns. As such, investors need to carefully evaluate the market and macro landscape to consider how the future could play out. In short, don’t let FOMO lead to poor portfolio construction.
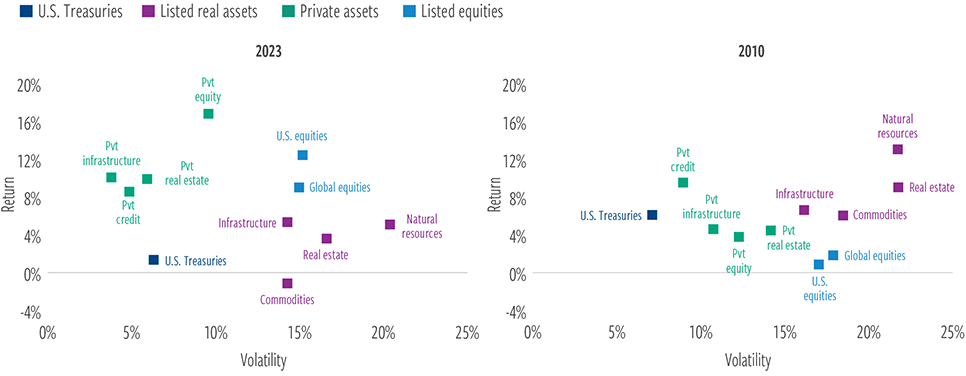
What is driving this thinking? To begin, consider the last decade, as shown in Exhibit 1 (left side). In the 10 years through 2023, global equities delivered a total return in excess of 8% per annum; U.S. equities were even more impressive, with a stunning annualized return of more than 12%. The performance of private assets was likewise remarkable, with double-digit returns in most categories amid extremely low (reported) volatility—more on this later.
Meanwhile, real asset returns were substantially lower. Excluding dividends, listed real estate returns would have barely been positive, while commodities had negative returns for the decade. Notably, U.S. Treasury returns were also paltry, driven by the starting point of interest rates post the global financial crisis (GFC) and the sharp rise in rates in 2022.
EXHIBIT 1
Asset class performance often changes over time
10-year annualized volatility/return (ending in 2023 and 2010)
At December 31, 2023. Source: Burgiss, Barclays, Bloomberg, Dow Jones, FTSE, S&P, LSEG Datastream, Cohen & Steers.
Past performance is no guarantee of future results. The information presented above does not represent the performance of any fund or other account managed or serviced by Cohen & Steers, and there is no guarantee that investors will experience the type of performance listed above. Standard deviation, which represents historical volatility, is a measure of the dispersion of a set of data from its mean and is used by investors as a gauge of the amount of expected volatility. See endnotes for index associations, definitions and additional disclosures.
These recent returns stand in stark contrast to the 10 years that ended in 2010, which extend into the recovery following GFC lows. During that decade, equities were, by far, the worst-performing asset class (barely positive even with dividends). U.S. Treasuries returns, meanwhile, were strong, driven by falling interest rates and accommodative monetary policy. Private markets were also substantially weaker—and registered higher volatility during that period. Conversely, real assets were standout performers, led by natural resources.
In short, assets that performed well from 2001 through 2010 fared worse in the last decade, and vice versa. It should come as no surprise that returns are often unstable and mean-reverting, with starting valuations being key to future performance. While it is easy to become enamored with what has worked best recently, it’s common to see reversals of fortune. Chasing leaders and succumbing to FOMO after 2010 would have been a recipe for poor returns. The current backdrop suggests that another inflection point may be upon us.
Little juice left to squeeze from equities
One key headwind for equities over the next decade is the starting point for valuations. Consider the Shiller cyclically adjusted price-to-earnings (CAPE) ratio. This measure of valuation is near an all-time high. While extreme valuations neither guarantee disastrous outcomes nor serve as catalysts for corrections, history suggests that 10-year forward returns tend to be challenged when the starting point for valuations is this elevated (Exhibit 2).
Looking ahead, we believe U.S. equity returns are likely to come (at best) solely from earnings growth and dividends rather than multiple expansion. More challenging outcomes are, of course, possible if multiples compress, as has been seen in previous episodes that began at these levels of valuation.
EXHIBIT 2
Current U.S. equity valuations pose headwinds to future returns
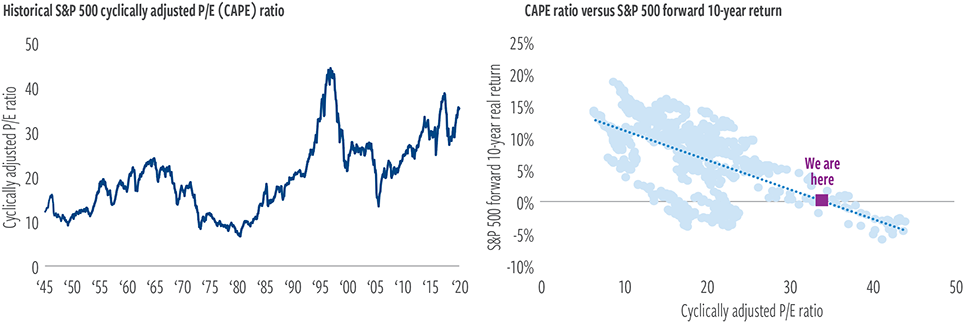
At September 30, 2024. Source: Research by Robert J. Shiller.
Past performance is no guarantee of future results. The information presented above does not represent the performance of any fund or other account managed or serviced by Cohen & Steers, and there is no guarantee that investors will experience the type of performance listed above. The cyclically adjusted price-to-earnings (CAPE) ratio is measured as the price of the S&P 500 Index divided by its 10-year moving average of earnings, adjusted for inflation.
Private asset classes also face headwinds
There are also reasons to believe private markets will struggle to repeat the extraordinary returns and (likely mischaracterized) low volatility of the past decade. Regarding volatility, it is worth noting that the true risks within these asset classes are higher than the statement volatility suggests due to appraisal valuations and other features of illiquidity. The lags of returns witnessed in private versus public real estate in this most recent cycle, and in previous cycles, underscore this reality. While this may be an attractive feature to some investors, there are implicit costs. For example, illiquidity impacts the ability to rebalance portfolios and to take advantage of market dislocations to sell at peaks or buy at troughs. (This has been apparent in recent years.) Moreover, in asset classes such as core private real estate, there is no evidence that an illiquidity risk premium exists for investors.
One factor that has impacted both returns and volatility across private markets—the multi-decade decline in interest rates—is likely behind us. We believe yields of 4.0% to 4.5%, levels well above those that prevailed for most of the last decade, represent fair value in U.S. Treasuries. Consequently, the opportunity for private assets to lever investments at ultra-low and stable interest rates has largely vanished.
Private equity markets also rely on the ability to exit investments and return capital to investors. As it stands today, deal volume in IPO markets is near its all-time low. If broad equity valuations and overall returns falter, exits could remain challenging.
Stock and bond returns have become increasingly correlated, providing traditional portfolios with less diversification than investors may expect.
Private credit faces several challenges as well. Private credit benefited from major credit cycles when spreads blew out during the post–tech bubble and GFC periods. Now, in addition to higher interest rates, there is the issue of very tight spreads. As with stocks, the starting point of valuations matters. The rapid growth of assets and competition in the private credit market also pose a challenge. Private credit is now a $2 trillion asset class, 10 times larger than it was in 2009, according to Preqin. Given the increased competition in this market, there is a strong likelihood that returns will converge towards the broad corporate bond market.
Diversification challenges: Concentration and correlation
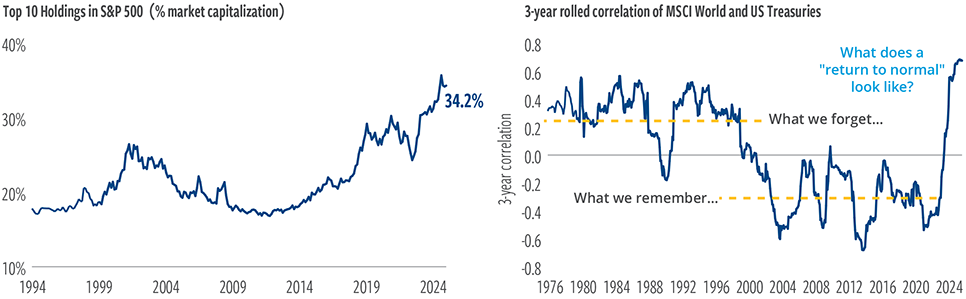
Diversification is another key aspect to portfolio construction and strategic asset allocation. In addition to the return challenges investors may face in equities, courtesy of elevated valuations, another issue of concern that may not be on investors’ radar is the high degree of concentration in market- capitalization-weighted stock indexes.
Equity market concentration has more than doubled in the past decade (Exhibit 3, left chart). Strikingly, markets haven’t seen this degree of concentration since the so-called “Nifty Fifty” era, which ultimately endured a spectacular collapse during the stagflationary bear market of the early 1970s. Just a handful of stocks now represent a large share of the market’s overall capitalization and, therefore, risk and return outcomes. In effect, this results in a significant loss of diversification potential from equities.
Meanwhile, stock and bond returns have become increasingly correlated, which means that stock-bond portfolios offer less diversification than investors have come to expect (Exhibit 3, right chart). When inflation was low and falling, the correlation turned negative. Bonds served as a cushion, protecting portfolios when equities struggled. But as inflation moved higher and interest rates normalized, the correlation changed. Correlation between stocks and bonds has turned positive, a condition that predates many investors’ experience. In 2022, this danger was there for all to see as both stocks and bonds declined, resulting in one of the worst years ever for the typical 60/40 portfolio.
Higher interest rates suggest better return prospects in fixed income markets and, therefore, a greater appeal than in the prior decade. However, increasing one’s allocation to fixed income comes with an array of added risks. For one, portfolios become more sensitive to inflation and duration risk.
Following Republican presidential and congressional wins in the U.S. election, we see the potential for economic impacts in several areas, including trade policy, immigration and fiscal policy. All three can arguably be expected to deliver an inflationary impulse, stemming from higher tariffs, lower immigration, and lower taxes.
Furthermore, if today’s higher correlation between stocks and bonds persists, total portfolio volatility and risk may remain elevated due to lower overall portfolio diversification.
EXHIBIT 3
The 60/40 portfolio offers increasingly less diversification than in the past
At September 30, 2024. Source: Strategas Securities, LSEG Datastream, Bloomberg, Morningstar, Cohen & Steers.
Past performance is no guarantee of future results. There is no guarantee that any historical trend illustrated above will be repeated in the future, and there is no way to predict precisely when such a trend will begin.
Asset allocators are facing a historical inflection point
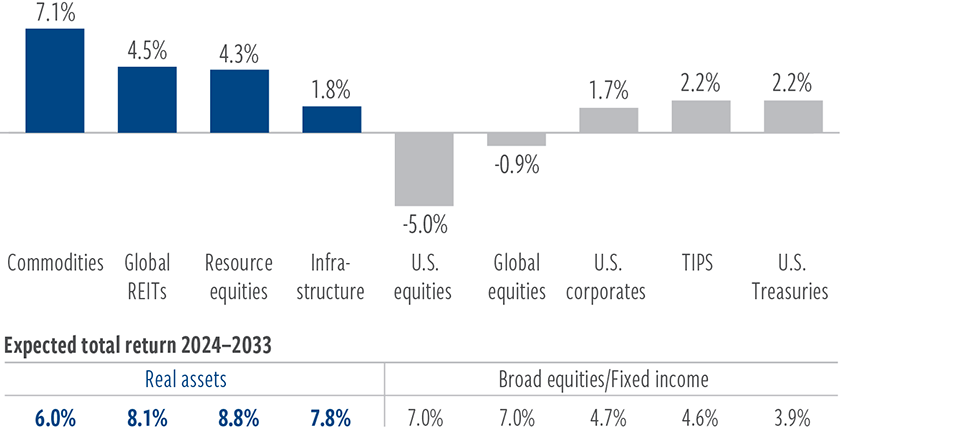
Our analysis indicates that we are entering a period consistent with an inflection point in the economic cycle and market backdrop. As we laid out in our 2024 Capital Markets Assumptions report, we believe the coming decade will be characterized by slower economic growth and higher, more volatile inflation (averaging around 3%, compared with the 1.8% rate of the previous decade). The bars in Exhibit 4 show the difference in returns we expect over the next decade as compared with the last 10 years. Point estimates of returns are also shown in the lower table. In short, as we see it, a reversal of fortunes is more likely than not.
Given their stretched valuations, we believe U.S. equities are set for more subdued annualized returns of around 7%, well below their returns in the last 10 years. Non-U.S. equities may produce similar returns, as a more attractive valuation starting point is offset by lower levels of profitability and slower earnings growth. Higher rates have made fixed income assets increasingly attractive. Though U.S. Treasuries should see an improvement over the previous decade, the expected annual return of 3.9% over the next 10 years is nevertheless relatively modest, and inflation surprises could threaten real returns.
In contrast, all core real assets categories are either neutrally or attractively valued and, we believe, positioned for meaningfully more substantial returns— compared with both the prior 10 years and relative to other asset classes. We see companies in the space as poised for higher profitability levels, driven by factors such as commodity undersupply (following years of underinvestment) and a move away from globalization toward onshoring. Other persistent inflationary pressures, as well as greater geopolitical uncertainty, also support real assets.
Natural resource equities and real estate are best positioned for the new regime, with expected annual returns in excess of 8% on tap—nearly double their prior-decade performance. Expected total returns for global listed infrastructure also appear attractive at 7.8%. Commodities, we believe, will see the most substantial improvement in returns amid undersupply and higher production costs.
EXHIBIT 4
Changes in return expectations favor real assets
Cohen & Steers’ capital market expectations for annualized returns vs. prior decade (%)
At June 30, 2024. Source: LSEG Datastream, Bloomberg, Cohen & Steers.
IMPORTANT: The capital market assumptions regarding the likelihood of various investment outcomes are hypothetical in nature, do not reflect actual investment results and are not guarantees of future results. The expectations and other information are for educational and illustrative purposes only. Hypothetical performance has inherent risks and limitations, and prospective investors should not place undue reliance on any such information. Because of Cohen & Steers’ investment focus on real assets, Cohen & Steers will benefit from increased interest in the real asset classes and you should keep this conflict in mind when evaluating the capital market assumptions. Other investments may have characteristics similar or superior to real assets. Additionally, Cohen & Steers may make investment decisions that are inconsistent with the capital markets assumptions or any views expressed herein.
Cohen & Steers may also develop and publish material that is independent of, and different than, the capital market assumptions or any views expressed herein.
The intent of the capital markets assumptions is not to predict or project future returns of any investment, asset class or portfolio. Instead, the purpose of the capital markets assumptions is to express Cohen & Steers’ view of expected general asset class returns of the period shown, which may be incorrect, potentially materially so, and are subject to change without notice. See endnotes for the Criteria and Methodology.
Real assets offer investors distinctive portfolio benefits
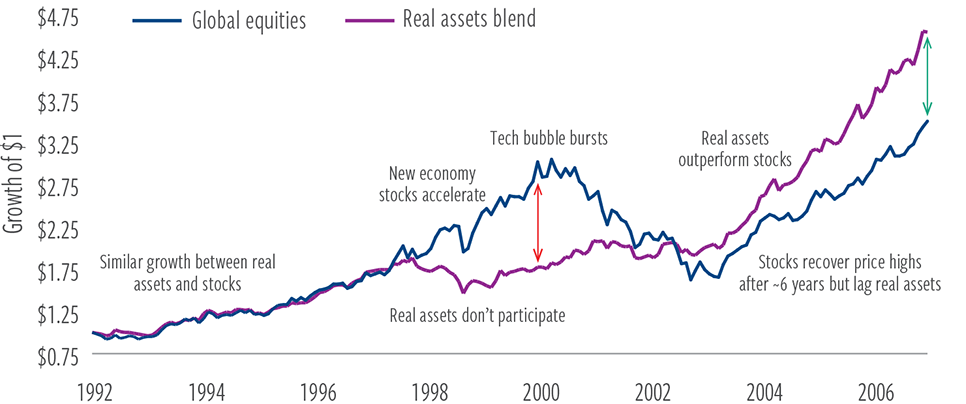
Beyond our favorable return outlook for real assets over the next decade, and in addition to their history of strong full-cycle returns, real assets offer valuable diversification potential. While metrics such as correlation and beta are often used to highlight this, these summary statistics can lack intuitive clarity. A breakdown of a market cycle may better illustrate how real assets diversify stock and bond exposures (Exhibit 5).
Here, we examine the 15-year market cycle from 1992 through 2006—a period marked by a historic market boom, bust and recovery—to gain insight into the value of a diversified real assets allocation. Arguably, there are echoes of this same dynamic in today’s market. Stock valuations are once again in the 90th+ percentile, driven by investor interest in technology stocks and the handful of companies that dominate the market.
After initially tracking equities, real assets largely sat out the 1997–1999 tech bubble rally, lagging as “new economy” narratives took hold. When the bubble burst, real assets outperformed as stocks plunged nearly 50%. They continued to excel through the recovery, driven by their unique risk/ return dynamics. Notably, while individual core real asset categories at times faced steep drawdowns themselves, a diversified blend of real assets saw only half the maximum drawdown of equities. In effect, core real assets also efficiently diversified each other across the full cycle period.
EXHIBIT 5
Diversification goes beyond correlation statistics
Historical returns before, through and after the tech bubble
At September 30, 2024. Source: Bloomberg, Cohen & Steers.
Past performance is no guarantee of future results. The information presented above does not reflect the performance of any fund or other account managed or serviced by Cohen & Steers, and there is no guarantee investors will experience the type of performance reflected above. There is no guarantee that any historical trend illustrated above will be repeated in the future, and there is no way to predict precisely when such a trend might begin. See endnotes for index associations, definitions and additional disclosures.
Zooming out and looking at market history through a different lens—one that considers economic conditions as well as initial conditions of sentiment and valuation—may help investors understand the distinctive diversification benefits of real assets. We believe today’s historically stretched broad market valuation and related concentration risks underscore the need for effective portfolio diversifiers.
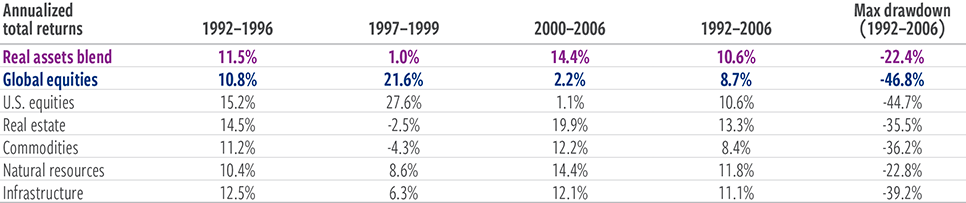
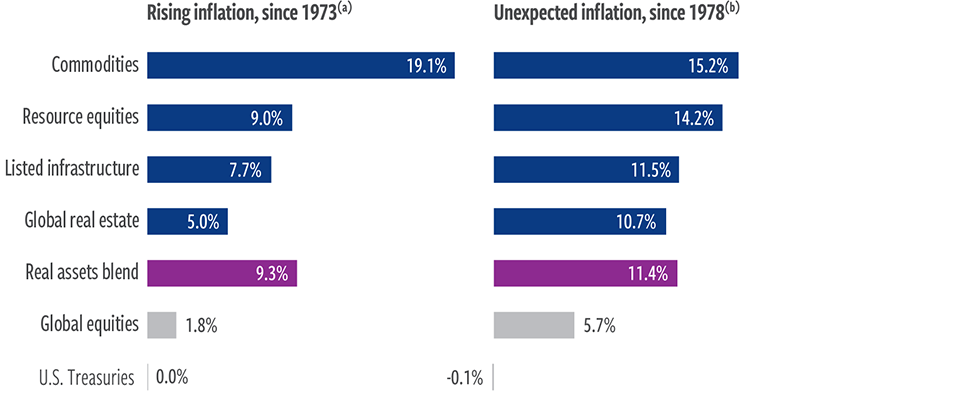
Inflation sensitivity sets real assets apart
Real assets have historically shown resilience in a variety of economic and market environments, with payoffs that are often unsynchronized from the broad global equity market. And while real assets offer the potential for attractive full-cycle returns, their most distinguishing feature is their inflation sensitivity, which can help to buffer the adverse effect that inflation tends to have on equity and fixed income returns.
As Exhibit 6 demonstrates, inflation tends to be most damaging to a portfolio of stocks and bonds when the market does not see it coming, whether that “surprise” is proxied by year-over-year changes in the inflation rate itself (left chart) or compares realized inflation to consensus expectations 12 months earlier (right chart). Over the last 50 years, unexpected inflation has occurred roughly half of the time—and such upside surprises have tended to negatively pressure both stock and bond returns. Real assets’ ability to counter inflation shocks offers potential benefits to portfolios in the short term, if prices unexpectedly climb, and in the longer term, should inflation rates more persistently surprise to the upside.
EXHIBIT 6
Real assets have historically outperformed in inflationary environments
Average annualized real returns in periods of…
At September 30, 2024. Source: Barclays, Bloomberg, Dow Jones, FTSE, S&P, LSEG Datastream, Cohen & Steers.
Past performance is no guarantee of future results. (a) Represents the common period of available asset class returns. Rising inflation measured as a positive difference between the year-over-year realized inflation rate and the lagged 1-year inflation rate. (b) Unexpected inflation data begins in 1978. Inflation measured as the year-over-year change in the Consumer Price Index for All Urban Consumers, published by the U.S. Bureau of Labor Statistics. Unexpected inflation measured as a positive difference between the year-over-year realized inflation rate and lagged 1-year-ahead expected inflation, as measured by the University of Michigan survey of 1-year-ahead inflation expectations.
The diversified blend of real assets shown above is composed of 27.5% real estate, 27.5% commodities, 15% natural resource equities, 15% infrastructure, 10% short-duration fixed income and 5% gold. The real assets blend is not representative of an actual portfolio and is for illustrative purposes only. Commodities’ performance includes back-tested returns. The information presented above does not reflect the performance of any fund or other account managed or serviced by Cohen & Steers, and there is no guarantee that investors will experience the type of performance reflected above. See endnotes for index associations, definitions and additional disclosures.
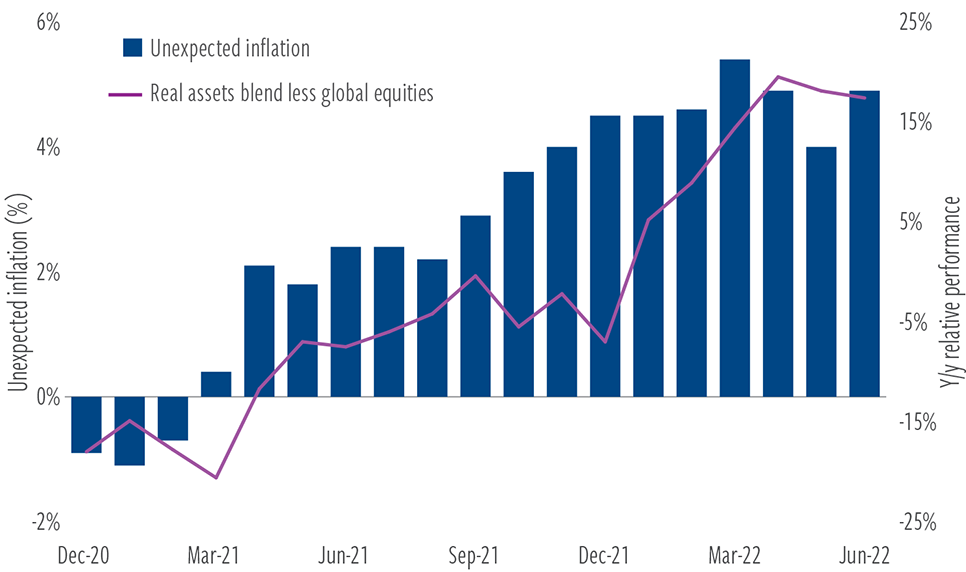
The post-Covid spike in inflation offers further, “real-time” proof of concept for the inflation sensitivity of real assets. Investors were blindsided by the inflation shock brought on by the confluence of lingering supply shortages and pent-up consumer demand. By the end of the second quarter of 2022, U.S. consumer inflation peaked around 9%—its highest level in more than 40 years, significantly above prior-year expectations.
Exhibit 7 compares the relative performance of diversified real assets versus global equities during this unexpected surge in inflation. The blue bars compare realized inflation to 12-month prior survey expectations, and we see that the shock peaked in the first half of 2022. Relative returns for real assets, as compared with global equities, similarly accelerated during this period. At the relative performance peak in April 2022 (purple line), real assets were up more than 16% year over year, while the MSCI World Index was down 3.5%, reflecting outperformance of nearly 20 percentage points. Unsurprisingly (given the magnitude of the inflation surge), bond returns were likewise challenged during this period, declining more than 10% by the time inflation peaked in June 2022.
Bottom line: In accordance with the deep historical data, as the shock of unexpected inflation unfolded, stock and bond returns suffered while real assets “worked”, delivering significant outperformance.
EXHIBIT 7
Preserving purchasing power
Real assets’ recent relative performance amid unexpected inflation
At September 30, 2024. Source: Barclays, Bloomberg, Dow Jones, FTSE, S&P, LSEG Datastream, Cohen & Steers.
Past performance is no guarantee of future results. Inflation measured as the year-over-year change in the Consumer Price Index for All Urban Consumers, published by the U.S. Bureau of Labor Statistics. Unexpected inflation measured as a positive difference between the year-over-year realized inflation rate and lagged 1-year-ahead expected inflation, as measured by the University of Michigan survey of 1-year-ahead inflation expectations. The diversified blend of real assets shown above is composed of 27.5% real estate, 27.5% commodities, 15% natural resource equities, 15% infrastructure, 10% short-duration fixed income and 5% gold. The real assets blend is not representative of an actual portfolio and is for illustrative purposes only. Commodities’ performance includes back-tested returns. The information presented above does not reflect the performance of any fund or other account managed or serviced by Cohen & Steers, and there is no guarantee that investors will experience the type of performance reflected above. See endnotes for index associations, definitions and additional disclosures.
A sensible permanent portfolio allocation
In the final analysis, as we see it, the beneficial attributes of real assets warrant a strategic allocation in every investor’s portfolio.
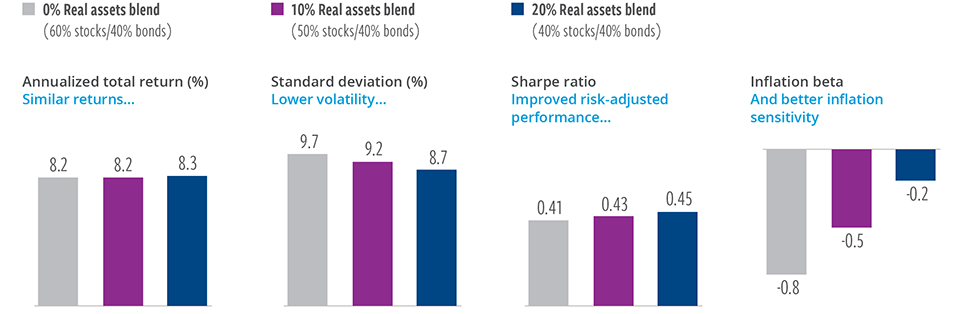
Historical analysis spanning multiple market cycles and economic regimes shows that including a blend of real assets in a representative portfolio of stocks and bonds offers the potential to preserve returns, reduce risk through greater diversification and improve portfolio efficiency—while also helping to defend against inflation (Exhibit 8).
We attribute these results to the distinct return drivers of the underlying assets and their individual sensitivities to the business cycle. Keep in mind that historically, no single real asset category has excelled across each of the criteria of total returns, diversification potential and inflation sensitivity. Some real assets have historically performed better on certain dimensions than others, requiring investors to consider various strengths and tradeoffs according to the specific role of real assets in their portfolios.
But thoughtful diversification across real assets is likely to deliver improved risk/reward outcomes, while also allowing investors to modulate the inherent negative inflation sensitivity of core stock and bond allocations toward something closer to neutral over the long haul.
EXHIBIT 8
Real assets can improve risk-adjusted returns
Effects of adding real assets to a stock/bond portfolio (1973–2024)
At September 30, 2024. Source: Barclays, Bloomberg, Dow Jones, FTSE, S&P, LSEG Datastream, Cohen & Steers.
Past performance is no guarantee of future results. The information presented above does not reflect the performance of any fund or other account managed or serviced by Cohen & Steers, and there is no guarantee that investors will experience the type of performance reflected above. An investor cannot invest directly in an index, and index performance does not reflect the deduction of any fees, expenses or taxes. Index comparisons have limitations, as volatility and other characteristics may differ from a particular investment. Return reflects compound annualized return. Risk reflects annualized standard deviation of monthly returns. There is no guarantee that any historical trend illustrated above will be repeated in the future, and there is no way to predict precisely when such a trend will begin. Inflation beta determined by calculating the multivariate regression beta of 1-year real returns to the difference between the year- over-year realized inflation rate and lagged 1-year-ahead expected inflation, including the level of the lagged expected inflation rate. Inflation is measured using the Consumer Price Index for All Urban Consumers, published by the United States Department of Labor’s Bureau of Labor Statistics. Expected inflation, as measured, reflects the median inflation expectation from the University of Michigan’s survey of 1-year-ahead inflation expectations. A real rate of return is the annual percentage return realized on an investment, which is adjusted for changes in prices due to inflation. See endnotes for index associations, definitions and additional disclosures.
ABOUT THE AUTHORS

Jeffrey Palma, Senior Vice President, is responsible for leading the firm’s asset allocation strategy and macroeconomic research.

Vince Childers, CFA, Senior Vice President, is Head of Real Assets Multi-Strategy and a portfolio manager for Cohen & Steers’ real assets strategy.
Index Definitions and important disclosures
An investor cannot invest directly in an index, and index performance does not reflect the deduction of any fees, expenses or taxes.
Capital markets assumptions criteria and methodology
Inputs to these expectations include return, volatility, and correlation across asset classes. Assumptions are generally not updated on a real-time basis, therefore results may vary with each use and over time. All such expectations are subject to change. Yields on all markets are based on levels derived at year-end 2022. Expectations for returns are driven by a range of factors. Within fixed income, forecasts for interest rates are determined at various maturities based on economic growth, inflation, and policy expectations as well as factors such as the shape of the yield curve, the expected level of real interest rates and inflation breakevens, and credit spreads. These interest rates are used to compute expectations for total returns, accounting for the starting point of bond yields, capital gain/loss based on assumption of benchmark duration, and yield. Treasury bond returns are based on expectations for the level of inflation, the path of future short-term rates, and an expectation for the slope of the yield curve. Credit returns, including corporate, high yield and preferreds are based on expectations of fair value spread levels along with adjustments for historical downgrade and default risk through an economic cycle. For equities, including listed real assets, various factors contribute to total return expectations. Expectations are based on estimates for earnings growth and fair value multiples. Earnings growth expectations are driven by anticipated profitability and payout ratios, while valuation multiples are based on expected interest rates, risk premiums, and growth rates. Changes in valuations are driven by forecasts of interest rates, risk premiums, growth, and profitability. Dividend yield also contributes to total return. For commodities, we forecast investable returns on commodity total returns by coming up with expectations on index-level spot returns, roll returns, and collateral returns. Spot returns are a function of inflation and expectations of supply/ demand/inventory balances, roll returns are a function of the typical shape of the commodity futures curve, and collateral returns are a function of our forecast for short term interest rates. Volatility assumptions are driven by historical experience as well as expectations for changes related to growth, inflation, policy, etc. Volatility for private real estate is adjusted (per academic work by Geltner) to more accurately reflect economic volatility to correct for the autocorrelation/smoothing that exists in private RE returns. Correlations reflect historical correlations. Forward-looking volatility and correlation assumptions are based on historical outcomes. Volatility data use the full available data history available for each respective market. Correlation data use a common starting point. Future economic and market conditions could result in different experiences in coming years. Due to the illiquid nature of private real estate, private real estate returns generally exhibit a return pattern that understates the level of volatility that would be realized if assets were valued more frequently. We used a statistical adjustment [Geltner, David. 1993. “Estimating Market Values from Appraised Values Without Assuming”] to adjust for the first-order autocorrelation in the appraisal-based private real estate return series to arrive at an estimate that more accurately reflects the true volatility of private real estate returns for the time periods shown. This adjustment also is applied to calculations of private real estate correlation to other asset classes. Estimates are inherently uncertain and may not reflect actual outcomes. Utilizing different factors or assumptions in conducting the statistical analysis may result in materially different estimates than those shown. Investing in private real estate involves substantial risk, including entire loss of investment. Certain inputs into the capital market assumptions have been obtained from sources that Cohen & Steers believes to be reliable as of the date presented; however, Cohen & Steers cannot guarantee the accuracy of such content, assure its completeness, or warrant that such information will not be changed. The content herein and inputs into the capital market assumptions are current as of the date of publishment (or such earlier date as referenced herein) and are subject to change without notice. Cohen & Steers does not make any express or implied warranties or representations as to the inputs into the capital market assumptions or the completeness or accuracy of its results.
Real assets blend: 27.5% real estate, 27.5% commodities, 15% infrastructure, 15% resource equities, 10% short-duration fixed income and 5% gold. Real estate: Datastream Developed Real Estate Index through 12/31/1989; FTSE EPRA/NAREIT Developed Index thereafter. The Datastream Developed Real Estate Index encompasses listed real estate companies in developed markets and is compiled by Refinitiv Datastream. The FTSE EPRA Nareit Developed Index is an unmanaged market- weighted total return index consisting of many companies from developed markets that derive more than half of their revenue from property-related activities. Commodities: S&P GSCI Index through 7/31/98; the Bloomberg Commodity Total Return Index thereafter. The S&P GSCI Index is a composite index of commodity sector returns representing an unleveraged, long-only investment in commodity futures that is broadly diversified across the spectrum of commodities. Performance for the S&P GSCI Index prior to January 1991 is hypothetical back-tested, not actual performance, based on the index methodology in effect on the launch date and using actual historical constituent-level data to reconstruct the index’s returns. The Bloomberg Commodity Total Return Index, formerly known as the Dow Jones-UBS Commodity Index, is a broadly diversified index that tracks the commodity markets through exchange-traded futures on physical commodities, which are weighted to account for economic significance and market liquidity. Infrastructure: 50/30/20 blend of Datastream World Gas, Water & Multi-Utilities, Datastream World Pipelines and Datastream World Railroads through 7/31/08; Dow Jones Brookfield Global Infrastructure Index thereafter. The Datastream World Index Series encompasses global indexes of companies in their respective sectors (World Gas, Water & Multi-Utilities; Materials; Oil & Gas; and Pipelines) and is compiled by Refinitiv Datastream. The Dow Jones Brookfield Global Infrastructure Index is a float-adjusted, market-capitalization-weighted index that measures the performance of globally domiciled companies that derive more than 70% of their cash flows from infrastructure lines of business. Resource equities: 50/50 Blend of Datastream World Oil & Gas and Datastream World Basic Materials through 5/31/08; S&P Global Natural Resources Index thereafter. The Datastream World Index Series encompasses global indexes of companies in their respective sectors (Datastream World Oil & Gas and Datastream World Basic Materials) and is compiled by Refinitiv Datastream. The S&P Global Natural Resources Index includes 90 of the largest publicly traded companies in natural resources and commodities businesses that meet specific investability requirements, offering investors a diversified, liquid and investable equity exposure across three primary commodity-related sectors: Agribusiness, Energy and Metals & Mining. Short-duration fixed income: The ICE BofA 1–3 Year U.S. Corporate Index tracks the performance of USD-denominated investment-grade corporate debt publicly issued in the U.S. domestic market with a remaining term to maturity of less than 3 years. Gold: Gold spot price in USD per troy ounce. Global stocks: MSCI World Index, a market-capitalization-weighted index consisting of a wide selection of stocks traded in 24 developed markets. U.S. Treasury bonds: The ICE BofA U.S. Treasury 7-10 Year Bond Index measures the performance of public obligations of the U.S. Treasury that have a remaining maturity of greater than 7 years and less than or equal to 10 years. Private real estate: MSCI Closed-End Private Real Estate Index. Private infrastructure: MSCI Closed-End Private Infrastructure Index. Private credit: MSCI Closed-End Private Credit Index. Private equity: MSCI Closed-End Private Equity Index. The MSCI Private Capital Closed-End Fund Indexes aim to measure the net-of-fees aggregate performance in unlisted closed-end private capital fund vehicles. The fund-level transaction data used in constructing the indexes are sourced exclusively through MSCI limited partner (LP) clients, which are investing into the fund vehicles.
Data quoted represents past performance, which is no guarantee of future results. There is no guarantee that any historical trend illustrated/referenced above will be repeated in the future, and there is no way to predict precisely when such a trend might begin. There is no guarantee that any market forecast set forth in this commentary will be realized. The views and opinions in the preceding commentary are as of the date of publication and are subject to change. Diversification does not ensure a profit or guarantee to protect against loss. There is no guarantee that actively managed investments will outperform the broader market.
This material represents an assessment of the market environment at a specific point in time and should not be relied upon as investment advice, does not constitute a recommendation to buy or sell a security or other investment, and is not intended to predict or depict performance of any investment. This material is not being provided in a fiduciary capacity and is not intended to recommend any investment policy or investment strategy or take into account the specific objectives or circumstances of any investor. We consider the information in this presentation to be accurate, but we do not represent that it is complete or should be relied upon as the sole source of appropriateness for investment. Please consult with your investment, tax or legal professional regarding your individual circumstances prior to investing. The views and opinions expressed are not necessarily those of any broker/dealer or its affiliates. Nothing discussed or suggested should be construed as permission to supersede or circumvent any broker/dealer policies, procedures, rules or guidelines.
Real assets risks. A real assets strategy is subject to the risk that its asset allocations may not achieve the desired risk/return characteristic, may underperform other similar investment strategies, or may cause an investor to lose money. The risks of investing in REITs are similar to those associated with direct investments in real estate. Property values may fall due to increasing vacancies; declining rents resulting from economic, legal, tax, political or technological developments; lack of liquidity; limited diversification; and sensitivity to certain economic factors such as interest rate changes and market recessions. The market value of securities of natural resource companies may be affected by numerous factors, including events occurring in nature, inflationary pressures and international politics. Global infrastructure securities may be subject to regulation by various governmental authorities, such as rates charged to customers; operational or other mishaps; tariffs; and changes in tax laws, regulatory policies and accounting standards. Foreign securities involve special risks, including currency fluctuation and lower liquidity. An investment in commodity-linked derivative instruments may be subject to greater volatility than investments in traditional securities, particularly if the instruments involve leverage. The value of commodity-linked derivative instruments may be affected by changes in overall market movements, commodity index volatility, changes in interest rates, or factors affecting a particular industry or commodity, such as drought, floods, weather, livestock disease, embargoes, tariffs and international economic, political and regulatory developments. The use of derivatives presents risks different from, and possibly greater than, the risks associated with investing directly in traditional securities. Among the risks presented are market risk, credit risk, counterparty risk, leverage risk and liquidity risk. The use of derivatives can lead to losses because of adverse movements in the price or value of the underlying asset, index or rate, which may be magnified by certain features of the derivatives. No representation or warranty is made as to the efficacy of any particular strategy or fund or the actual returns that may be achieved. Futures trading is volatile and highly leveraged and may be illiquid. Investments in commodity futures contracts and options on commodity futures contracts have a high degree of price variability and are subject to rapid and substantial price changes. Such investments could incur significant losses. There can be no assurance that the options strategy will be successful. The use of options on commodity futures contracts is to enhance risk-adjusted total returns. However, the use of options may not provide any, or may provide only partial, protection from market declines. The return performance of the commodity futures contracts may not parallel the performance of the commodities or indexes that serve as the basis for the options they buy or sell; this basis risk may reduce overall returns.
Cohen & Steers Capital Management, Inc. (Cohen & Steers) is a U.S. registered investment advisory firm that provides investment management services to corporate retirement, public and union retirement plans, endowments, foundations and mutual funds. Cohen & Steers U.S. registered open-end funds are distributed by Cohen & Steers Securities, LLC and are only available to U.S. residents. Cohen & Steers Asia Limited is authorized and regulated by the Securities and Futures Commission of Hong Kong (ALZ367). Cohen & Steers Japan Limited is a registered financial instruments operator (investment advisory and agency business and discretionary investment management business with the Financial Services Agency of Japan and the Kanto Local Finance Bureau No. 3157) and is a member of the Japan Investment Advisers Association. Cohen & Steers UK Limited is authorized and regulated by the Financial Conduct Authority (FRN458459). Cohen & Steers Ireland Limited is regulated by the Central Bank of Ireland (No.C188319). Cohen & Steers Singapore Private Limited is a private company limited by shares in the Republic of Singapore.
For recipients in the Middle East: This document is for informational purposes only. It does not constitute or form part of any marketing initiative, any offer to issue or sell, or any solicitation of any offer to subscribe or purchase, any products, strategies or other services, nor shall it or the fact of its distribution form the basis of, or be relied on in connection with, any contract resulting therefrom. In the event that the recipient of this document wishes to receive further information with regard to any products, strategies or other services, it shall specifically request the same in writing from us.