


Preferred securities offer a rare combination of high income, diversification and quality—making them a potentially valuable addition to core and core-plus portfolios.
KEY TAKEAWAYS
- An opportunity to boost returns without altering portfolio risk
An allocation to preferred securities in a broad fixed income portfolio has historically increased income and total return while keeping risk profiles relatively stable. - High income from high-quality, mostly regulated issuers
Preferreds deliver some of the highest yields in fixed income, often with tax-advantaged treatment, and are issued mainly by high-quality regulated banks, insurers and defensive utilities. - Strong diversifying characteristics
A preferreds allocation introduces a new set of return drivers to fixed income portfolios, increasing income, improving diversification and helping to smooth performance over time.
Higher returns without sacrificing quality
Preferred securities are often an under utilized investment choice for fixed income portfolios. Yet preferreds can be a valuable tool, potentially contributing higher income, solid risk-adjusted returns, and broader portfolio diversification. In effect, a preferreds allocation can help bridge the gap between investment-grade bonds and high yield debt—often delivering much of the return boost of high yield, but with historically lower volatility due to issuance concentrated in regulated, investment- grade sectors such as banks, insurers and defensive utilities.
A model portfolio analysis shows that, over the last 10 years, allocating 10–20% to preferreds in core and core-plus portfolios increased annualized returns by 40–80 basis points (100 basis points equals 1 percentage point), while essentially maintaining the same level of risk (Exhibit 1). Increasing the preferred allocation to 30% resulted in even greater returns, without materially increasing volatility. In all cases, the Sharpe ratio (risk-adjusted return) improved from slightly negative or slightly positive, indicating a meaningful uplift in efficiency across all weightings by adding preferred securities.
The dynamic of improved return and risk metrics is the same when combining preferreds with either investment-grade corporates, high yield bonds or municipals.
Preferred securities also boost portfolio income. And since preferred dividends are often tax advantaged, investors keep more of their earnings (see page 5).
EXHIBIT 1
Allocations to preferred securities enhance core and core-plus portfolio performance
Hypothetical portfolio annualized return vs. volatility since 09/30/2015

At September 30, 2025. Source: ICE BofA, Bloomberg, Morningstar, Cohen & Steers.
Data quoted represents past performance, which is no guarantee of future results. Preferreds represented by ICE BofA U.S. Institutional Capital Securities Index. Core bonds represented by Morningstar U.S. Fund Intermediate Core Bond category average returns; Bloomberg U.S. Aggregate Bond Index yield to worst. Core-plus represented by Morningstar U.S. Fund Intermediate Core Plus Bond category average returns; Bloomberg U.S. Aggregate Bond Index yield to worst. Volatility represented by standard deviation, a statistical measure of how spread out a dataset is from its mean. Sharpe ratio is a measure of risk-adjusted return, calculated by subtracting the risk-free rate from a return and dividing that result by the standard deviation. The higher the Sharpe ratio, the higher the risk-adjusted return. Yields are shown on an after-tax yield-to-worst basis (the lowest potential return an investor can receive on a callable bond, assuming the worst-case scenario for call dates and penalties). Assumes taxation at the highest marginal U.S. Federal income tax rate of 37% for taxable interest income and 20% for qualified dividend income (QDI), with an additional 3.8% Medicare surcharge on all tax rates. See endnotes for index definitions and additional disclosures.
Higher returns without sacrificing quality
Preferred securities have historically delivered returns superior to traditional fixed income investments (Exhibit 2). In addition to their high income, we believe this outperformance stems from the credit strength of the issuers.
Preferreds are typically issued by investment-grade companies such as global banks, large insurers and utilities—which benefit from stable business models and operate under meaningful regulatory oversight. That oversight protects banks’ balance sheets through capital and liquidity requirements and stress testing, among other factors. Preferreds often carry BBB to BB ratings despite being issued by A-rated companies, as ratings mainly reflect their subordination—they rank below senior debt— and the fact that dividends can be deferred or omitted. These features affect a security’s rating, but they do not reflect the issuer’s strength.
In normal cycles, preferred investors are well compensated for taking a subordinated position, receiving yields that often rival those of junk bonds even though the underlying companies are investment grade.
The preferred market has evolved, with traditional tax-advantaged preferreds now complemented by high-quality hybrids that improve diversification and risk-adjusted outcomes. These hybrids offer equity- credit amortization for issuers, and, increasingly, coupon floors, features that reduce extension risk and limit duration risk across market cycles. Issuance has expanded beyond banks to non-financial issuers, such as regulated utilities seeking tax-efficient financing. The result: stronger structures, broader issuer diversity, and improved stability compared with the traditional perpetual preferred landscape.
EXHIBIT 2
Preferreds have steadily outperformed over much of the past decade
Rolling 3-year excess returns (preferreds minus core and core-plus categories)
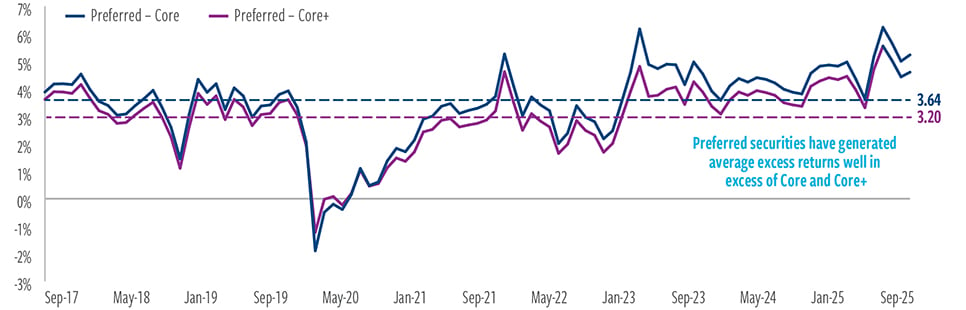
At September 30, 2025. Source: Morningstar, Cohen & Steers.
Past performance is no guarantee of future results. Preferred securities are represented by ICE BofA Capital Securities Index. Core bonds represented by Morningstar U.S. Fund Intermediate Core Bond category average returns. Core-plus represented by Morningstar U.S. Fund Intermediate Core Plus Bond category average returns. See endnotes for index definitions and additional disclosures.
Preferreds are an all-weather portfolio solution
Preferred securities have historically provided strong relative total returns over full market cycles, compared with other fixed income categories (Exhibit 3). The past decade has seen shifting interest rate and credit spread conditions. Yet returns for preferreds were often well balanced with those in other fixed income classes on a calendar year basis, frequently outperforming the peer group as a whole, due largely to their high income and the strong credit quality of their predominantly regulated issuers.
The preferred market is dominated by fixed-to-reset structures, which can lower a security’s duration, reducing sensitivity to changes in interest rates. Adding preferreds to a core bond portfolio heavy in long duration Treasuries and corporates (which have durations of 5–8 years or more) may maintain or even reduce overall duration.
Low-duration preferreds (those with durations of three years or less) account for nearly half of the preferred universe. Actively allocating to these securities can further reduce a portfolio’s interest rate sensitivity while still delivering strong total returns and attractive, relatively stable income.
EXHIBIT 3
Preferreds have delivered strong performance across market cycles
Annual total returns by fixed income asset class
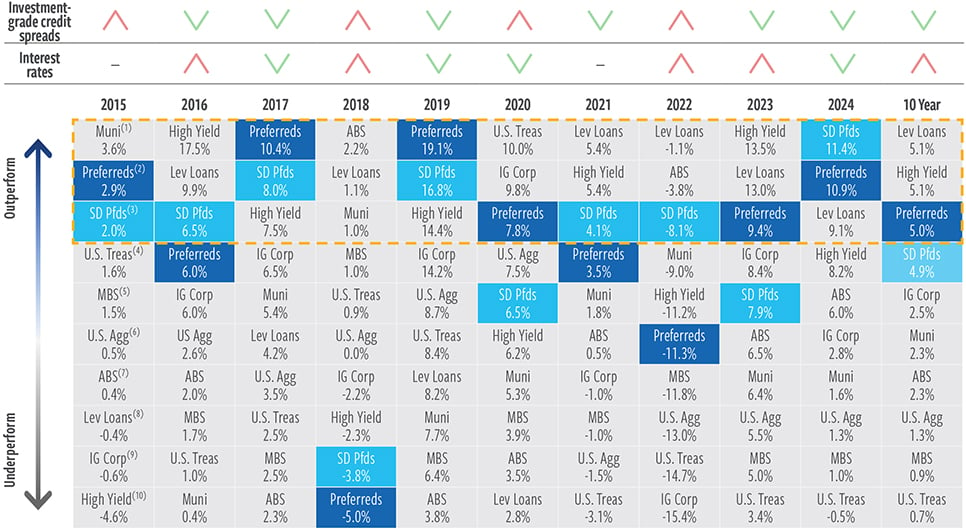
At September 30, 2025. Source: ICE BofA, Bloomberg, Cohen & Steers.
Past performance is no guarantee of future results. Investment-grade credit spread is the difference in yields between investment-grade debt and U.S. Treasury securities. (1) Bloomberg Municipal Index. (2) ICE BofA U.S. Institutional Capital Securities. (3) ICE BofA 8% Constrained Developed Markets Low Duration Capital Securities Custom Index. (4) ICE BofA 7-10 Year U.S. Treasury Index. (5) Bloomberg U.S. Mortgage-backed Securities Index. (6) Bloomberg U.S. Aggregate Bond Index. (7) ICE BofA U.S. Fixed & Floating Rate Asset Backed Securities Index. (8) S&P UBS Leveraged Loan Index. (9) ICE BofA U.S. Corporate Index. (10) ICE BofA U.S. High Yield Index. See endnotes for index definitions and additional disclosures.
Greater income generation, both before and after taxes
Preferreds are seen as having higher risks than senior bonds—namely, due to potential non-payment and greater subordination. Given these risks, investors receive higher compensation for investing in preferreds. Consequently, preferreds offer some of the highest yields in fixed income, both before and after taxes (Exhibit 4). On an after-tax basis, preferreds offer higher income than high yield debt, with significantly less credit risk.
For individuals: Many preferred securities pay qualified dividend income (QDI) under Internal Revenue service criteria and are taxable at the capital gains tax rate, which for U.S. investors is just 20%, plus the 3.8% Medicare surcharge, for investors in the top tax bracket (compared with a combined rate of 40.8% for interest income).
For corporations: U.S. institutional investors structured as C-corporations can take advantage of the “dividend received deduction” (DRD) tax treatment, reducing the tax rate on income from qualifying preferreds.
For example, for a corporate investor with a 21% tax rate, the effective tax on preferred income may fall to just 10.5%. This means a DRD-eligible preferred paying 6.0% would have an after-tax yield of 5.4%, compared with just 4.7% for a non-DRD security with the same pre-tax yield.
EXHIBIT 4
Preferreds yields are among the highest in fixed income
Pre-and post-tax yields of fixed income asset classes
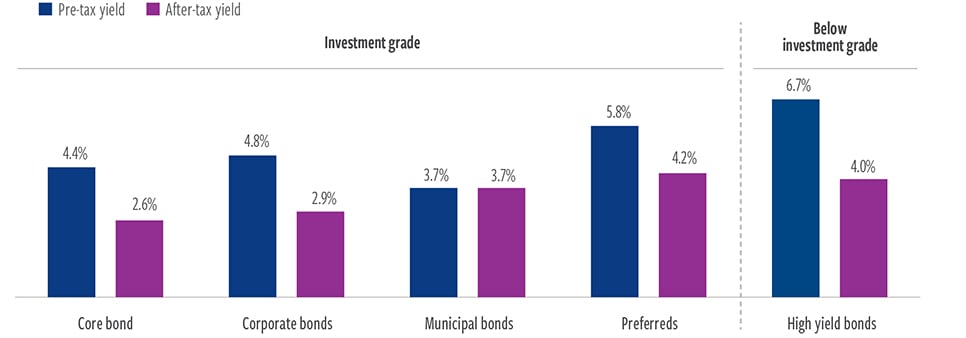
At September 30, 2025. Source: ICE BofA, Bloomberg, Cohen & Steers.
Past performance is no guarantee of future results. The information presented above does not reflect the performance of any fund or other account managed or serviced by Cohen & Steers, and there is no guarantee that investors will experience the type of performance reflected above. After-tax yields assumes taxation at the highest marginal U.S. Federal income tax rate of 37% for taxable interest income and 20% for qualified dividend income (QDI), with an additional 3.8% Medicare surcharge on all tax rates. After tax calculation assumes preferred securities income is taxed at the respective qualified dividend rate and marginal tax rate on a 75/25 blended basis; all other securities reflect full taxation at the respective marginal rates based on income. Core bonds represented by the Bloomberg U.S. Aggregate Bond Index. Corporate bonds represented by the ICE BofA U.S. Corporate Index. Municipal bonds represented by the ICE BofA U.S. Municipal Securities Index. High yield bonds represented by the ICE BofA U.S. High Yield Index. Preferreds represented by ICE BofA U.S. Institutional Capital Securities Index. See endnotes for index definitions and additional disclosures.
Strong diversifying characteristics
As noted previously, preferreds often behave differently from traditional fixed- income sectors due to their distinctive issuer base and structural features.
Issuers are mainly financial institutions or other non-cyclical companies with highly regulated businesses and/or high, stable and transparent cash flows. Financials account for more than 50% of preferred issuance, but they represent less than 25% of the investment-grade corporate bond market and only 6% in high yield bond indexes. Conversely, sectors that dominate high- yield (energy and basic materials) are minimal allocations in preferreds.
Exhibit 5 shows correlations of different investment strategies over various rolling periods. Even to corporate bonds and high yield bonds, which share credit sensitivity, preferreds’ correlations have been somewhat moderate— in the 0.7–0.8 range—indicating that, while not completely independent, they nevertheless provide valuable diversification. In essence, including a preferreds allocation introduces a new set of return drivers to a fixed income portfolio, which can help smooth performance.
Investors seeking to elevate fixed income portfolio outcomes should consider a dedicated allocation to preferred securities. Preferreds offer a compelling blend of high income, high quality and diversification—qualities that are increasingly valuable in today’s challenging fixed income landscape. Their ability to enhance returns without materially increasing risk, combined with tax-efficient income, makes them a strategic fit for superior core and core-plus portfolios.
EXHIBIT 5
Preferreds offer diversifying correlations to bonds and stocks
Median rolling correlations to preferred securities
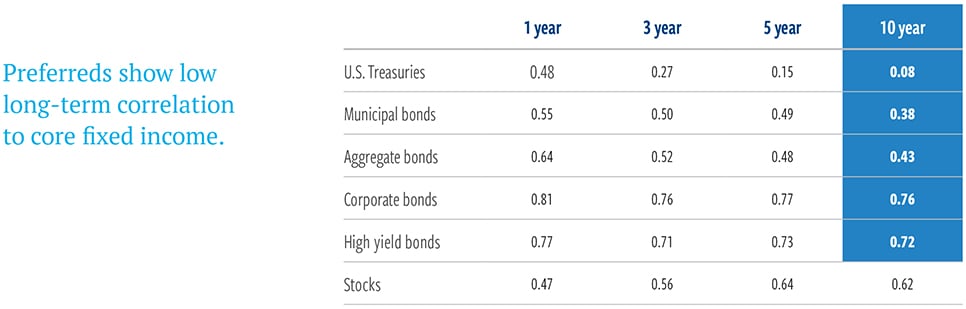
At September 30, 2025. Source: Cohen & Steers and Morningstar.
Past performance is no guarantee of future results. The information presented above does not reflect the performance of any fund or other account managed or serviced by Cohen & Steers, and there is no guarantee that investors will experience the type of performance reflected above. There is no guarantee that any historical trend illustrated above will be repeated in the future, and there is no way to predict precisely when such a trend will begin. An investor cannot invest directly in an index, and index performance does not reflect the deduction of any fees, expenses or taxes. This chart is for illustrative purposes only and is not intended to represent the returns of any specific security. Debt securities, including preferred securities, corporate bonds, municipal bonds and high yield bonds, generally present various risks, including interest rate risk, credit risk, call risk, prepayment and extension risk, convertible securities risk, and liquidity risk. Index comparisons have limitations, as volatility and other characteristics may differ from a particular investment. Correlation coefficients are based on monthly data and measure the degree to which the returns of two assets move together. Correlations vary from –1.0 (perfect inverse relationship) to 1.0 (perfect synchronization). Preferred Securities are represented by ICE BofA Investment Grade Institutional Capital Securities Index through 12/31/2012. Thereafter, they consist of ICE BofA U.S. Institutional Capital Securities Index. Corporate bonds are represented by the ICE BofA Corporate Master Index, which tracks the performance of U.S. dollar-denominated investment-grade corporate debt publicly issued in the U.S. domestic market. U.S. high yield bonds are represented by the ICE BofA High Yield Master Index. U.S. Treasuries are represented by 7-10 Year U.S. Treasury Index. Municipal bonds are represented by the Bloomberg U.S. Municipal Index. The Bloomberg U.S. Aggregate Bond Index is a broad-market measure of the U.S. dollar-denominated investment-grade fixed-rate taxable bond market. Stocks are represented by the S&P 500. See endnotes for index definitions and additional disclosures.
ABOUT THE AUTHORS

Elaine Zaharis-Nikas, CFA, Executive Vice President, is Head of Fixed Income and Preferred Securities and a senior portfolio manager for the firm’s preferred securities portfolios.

Jerry Dorost, CFA, Senior Vice President, is a portfolio manager for fixed income and preferred securities portfolios and has analyst coverage responsibilities for U.S. banks.

Robert Kastoff, CFA, Vice President, is a portfolio manager for fixed income and preferred securities portfolios and has analyst coverage responsibilities for real estate and telecommunication industries.
Index definitions / important disclosures
An investor cannot invest directly in an index, and index performance does not reflect the deduction of any fees, expenses or taxes.
Preferred securities: ICE BofA U.S. I.G. Institutional Capital Securities Index (credit quality: BBB) tracks the performance of U.S. dollar-denominated investment-grade hybrid capital corporate and preferred securities publicly issued in the U.S. domestic market. Investment-grade corporate bonds: ICE BofA Corporate Master Index (credit quality: A-) tracks the performance of U.S. dollar-denominated investment-grade corporate debt publicly issued in the U.S. domestic market. High-yield bonds: ICE BofA High Yield Master Index (credit quality: B+) tracks the performance of U.S. dollar-denominated below-investment-grade corporate debt publicly issued in the U.S. domestic
market. Municipal bonds: ICE BofA Municipal Master Index (credit quality: AA-) tracks the performance of U.S. dollar-denominated investment-grade tax-exempt debt publicly issued by U.S. states and territories, and their political subdivisions, in the U.S. domestic market. U.S. Treasuries: 7-10 year U.S. Treasury Index tracks the performance of U.S. dollar-denominated sovereign debt publicly issued by the U.S. government in its domestic market. Mortgage- backed securities: Bloomberg U.S. MBS Index covers the mortgage-backed pass-through securities of Ginnie Mae (GNMA), Fannie Mae (FNMA) and Freddie Mac (FHLMC). Agencies: ICE BofA U.S. Composite Agency Index tracks the performance of U.S. dollar-denominated investment-grade U.S. agency debt issued in the U.S. domestic market. Asset backed securities: ICE BofA U.S. Fixed & Floating Rate Asset Backed Securities Index tracks the performance of U.S. dollar-denominated, investment grade (IG) ABS publicly issued in the U.S. domestic market. Leveraged loans: S&P UBS Leveraged Loan Index measures the market-value-weighted performance of the investable universe
of U.S. dollar-denominated leveraged loans. Bloomberg U.S. Aggregate Bond Index is a broad-market measure of the U.S. dollar-denominated investment-grade fixed-rate taxable bond market. The index includes Treasuries, government-related and corporate securities, mortgage-backed securities, asset-backed securities, and commercial mortgage-backed securities. Stocks: S&P 500 Index is an unmanaged index of 500 large-capitalization stocks that is frequently used as a general measure of U.S. stock market performance.
Data quoted represents past performance, which is no guarantee of future results. This material is for informational purposes and reflects prevailing conditions and our judgment as of this date, which are subject to change. There is no guarantee that any market forecast set forth in this presentation will be realized. This material represents an assessment of the market environment at a specific point in time and should not be relied upon as investment advice, does not constitute a recommendation to buy or sell a security or other investment, and is not intended to predict or depict the performance of any investment. This material is not being provided in a fiduciary capacity and is not intended to recommend any investment policy or investment strategy or to take into account the specific objectives or circumstances of any investor. We consider the information in this presentation to be accurate, but we do not represent that it is complete or should be relied upon as the sole source of appropriateness for investment. Please consult with your investment, tax or legal professional regarding your individual circumstances prior to investing.
Risks of investing in preferred securities. An investment in a preferred strategy is subject to investment risk, including the possible loss of the entire principal amount that you invest. The value of these securities, like other investments, may move up or down, sometimes rapidly and unpredictably. Our preferred strategies may invest in below-investment-grade securities and unrated securities judged to be below investment grade by the advisor. Below-investment-grade securities or equivalent unrated securities generally involve greater volatility of price and risk of loss of income and principal, and they may be more susceptible to real or perceived adverse economic and competitive industry conditions than higher-grade securities. The strategies’ benchmarks do not contain below-investment-grade securities.
Contingent capital securities (CoCos). CoCos are debt or preferred securities with loss absorption characteristics built into the terms of the security, for example, a mandatory conversion into common stock of the issuer under certain circumstances, such as the issuer’s capital ratio falling below a certain level. Since the common stock of the issuer may not pay a dividend, investors in these instruments could experience a reduced income rate, potentially to zero, and conversion would deepen the subordination of the investor, hence worsening the investor’s standing in a bankruptcy. Some CoCos provide for a reduction in the value or principal amount of the security under such circumstances. In addition, most CoCos are considered to be high yield securities and are therefore subject to the risks of investing in below-investment-grade securities.
Duration risk. Duration is a mathematical calculation of the average life of a fixed income or preferred security that serves as a measure of the security’s price risk to changes in interest rates (or yields). Securities with longer durations tend to be more sensitive to interest rate (or yield) changes than securities with shorter durations. Duration differs from maturity in that it considers potential changes to interest rates, and a security’s coupon payments, yield, price and par value and call features, in addition to the amount of time until the security matures. Various techniques may be used to shorten or lengthen the Fund’s duration. The duration of a security will be expected to change over time with changes in market factors and time to maturity.
Cohen & Steers Capital Management, Inc. (Cohen & Steers) is a U.S. registered investment advisory firm that provides investment management services to corporate retirement, public and union retirement plans, endowments, foundations and mutual funds. Cohen & Steers Asia Limited is authorized and regulated by the Securities and Futures Commission of Hong Kong (ALZ367). Cohen & Steers Japan Limited is a registered financial instruments operator (investment advisory and agency business and discretionary investment management business with the Financial Services Agency of Japan and the Kanto Local Finance Bureau No. 3157) and is a member of the Japan Investment Advisers Association. Cohen & Steers UK Limited is authorized and regulated by the Financial Conduct Authority (FRN458459). Cohen & Steers Ireland Limited is regulated by the Central Bank of Ireland (No.
C188319). Cohen & Steers Singapore Private Limited is a private company limited by shares in the Republic of Singapore.
For recipients in the Middle East: This document is for informational purposes only. It does not constitute or form part of any marketing initiative or any offer to issue or sell (or any solicitation of any offer to subscribe or purchase) any products, strategies or other services, nor shall it or the fact of its distribution form the basis of, or be relied on in connection with, any contract resulting therefrom. In the event that the recipient of this document wishes to receive further information with regard to any products, strategies or other services, it shall specifically request the same in writing from us.
All investing involves risk. Loss of principal is possible.
Investors should consider the investment objectives, risks, charges and expenses carefully before investing. For a prospectus or summary prospectus and other information about Cohen & Steers active ETFs, please call (866) 737- 6370; for Cohen & Steers open-end funds, please call (800) 330-7348. Read the prospectus or summary prospectus carefully before investing.
Foreside Fund Services, LLC, is the distributor of Cohen & Steers active ETFs. Cohen & Steers Securities, LLC, is the distributor of Cohen & Steers mutual funds. Foreside Fund Services, LLC, is not affiliated with Cohen & Steers.