

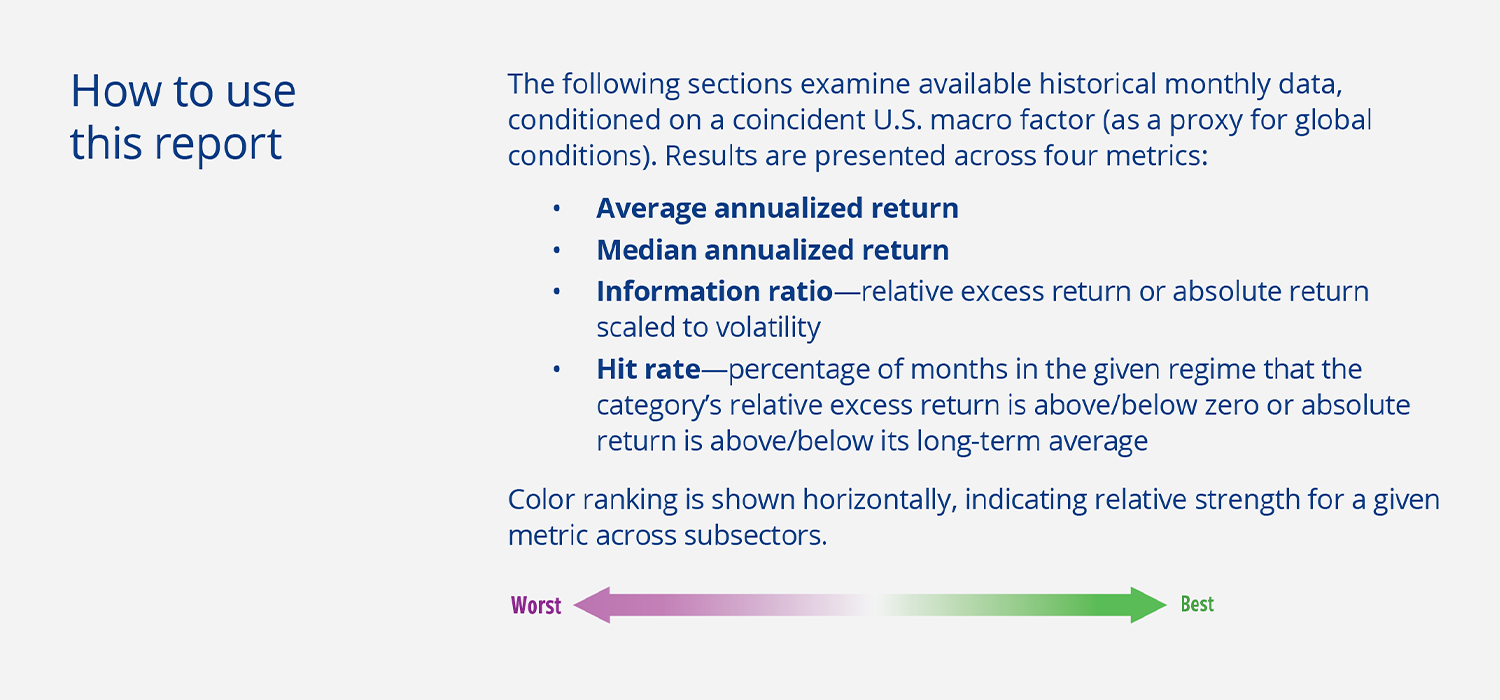
We examine performance characteristics across various market environments, providing a framework for understanding how listed infrastructure may fit into a broader asset allocation strategy and offering insight into the role of macroeconomic research in Cohen & Steers’ active investment process.
KEY TAKEAWAYS
- Differentiated behavior in growth and inflation regimes
Infrastructure has historically exhibited counter-cyclical behavior, offering equity-like returns over full market cycles, but with the potential for significant downside protection in defensive environments. Such periods are characterized by business cycle slowdowns (late cycle/recession), stagflation or inflationary conditions.
- Variety of subsectors within the asset class offer opportunities in most climates
Listed infrastructure historically has positive absolute returns in virtually all environments except during recessions. While infrastructure generally trails equities in risk-on environments, typically characterized by early/mid-cycle recoveries and low-inflation periods, certain subsectors typically perform well in those environments.
- Macro outlook plays a key role in our portfolio construction process
We rank and allocate to subsectors according to their favorability in the context of our current macro views, which we then combine with high conviction stock positions to build our portfolios. Based on where we are currently in each of the macro regimes discussed in this paper, we believe infrastructure is poised to maintain an attractive return profile going forward.
Executive summary
Asset class observations
The global economy has entered a new regime characterized by lower growth, higher inflation, higher interest rates and a movement away from significant oversupply and accommodative policies. Though navigating a new landscape may be challenging, we have seen and traversed regime shifts before.
We examined listed infrastructure’s performance relative to global equities in different macroeconomic environments since 1973, the earliest that reliable data is available. Based on these frameworks and our analysis of current economic conditions, we believe infrastructure is positioned to perform well versus broad global equities into 2023 as inflation persists and growth slows.
- Infrastructure has exhibited counter-cyclical behavior, offering equity-like returns over full market cycles, but with the potential for meaningful downside protection in defensive environments. Such periods are characterized by business cycle slowdowns (late cycle/recession), stagflation (defined here as when growth misses and inflation beats expectations), and medium- and high-inflation environments.
- By contrast, infrastructure generally lagged equities in positive economic environments, particularly in early- and mid-cycle recoveries, and when growth and inflation both surprised to the upside.
- Infrastructure had positive absolute returns in virtually all environments, except during recessions. However, recessions have been the periods of infrastructure’s greatest outperformance relative to equities.
We anticipate being in business cycle and inflation environments that favor infrastructure moving forward, based on our current views of economic growth and inflation outright and versus consensus market pricing.
Subsector observations
While infrastructure subsectors frequently performed as expected in a given regime, we observed certain patterns stemming from idiosyncratic factors in particular subsectors (though they may not be repeated in the future).
- Utilities (electric, gas and water) exhibited clear defensive properties, typically outperforming equities during recessions, stagnation and high- inflation environments.
- Transportation services (airports, toll roads and marine ports) were often more economically sensitive than other infrastructure subsectors and were among the only subsectors not to outperform equities during recessions.
- Telecom infrastructure (cell towers), measured by a custom index starting in 1998, significantly outperformed the overall infrastructure universe and other subsectors, impacting the pattern and magnitude of results in this study. We believe this was due largely to secular industry drivers that at times superseded the effect of macro factors. Consequently, the results in this report may not reflect the more defensive characteristics that we would typically expect from these businesses going forward.
- Rails have historically been among the most economically sensitive subsectors in the infrastructure universe. We believe results showing outperformance in down cycles are likely uncharacteristic of typical behavior due to structural changes to the group that have supported strong performance over the past two decades.
- Midstream energy (pipelines) exhibited counter-cyclical patterns, although we note that fast-rising shale production in North America has significantly influenced performance since the late 2000s. We believe midstream energy companies should generally be somewhat agnostic to external macroeconomic drivers.
Business cycles
Amid an uncertain macroeconomic backdrop, we believe global listed infrastructure should attract increased investor interest as an alternative source of performance due to the asset class’s performance characteristics and historically attractive full-cycle returns.
Relative performance vs. equities
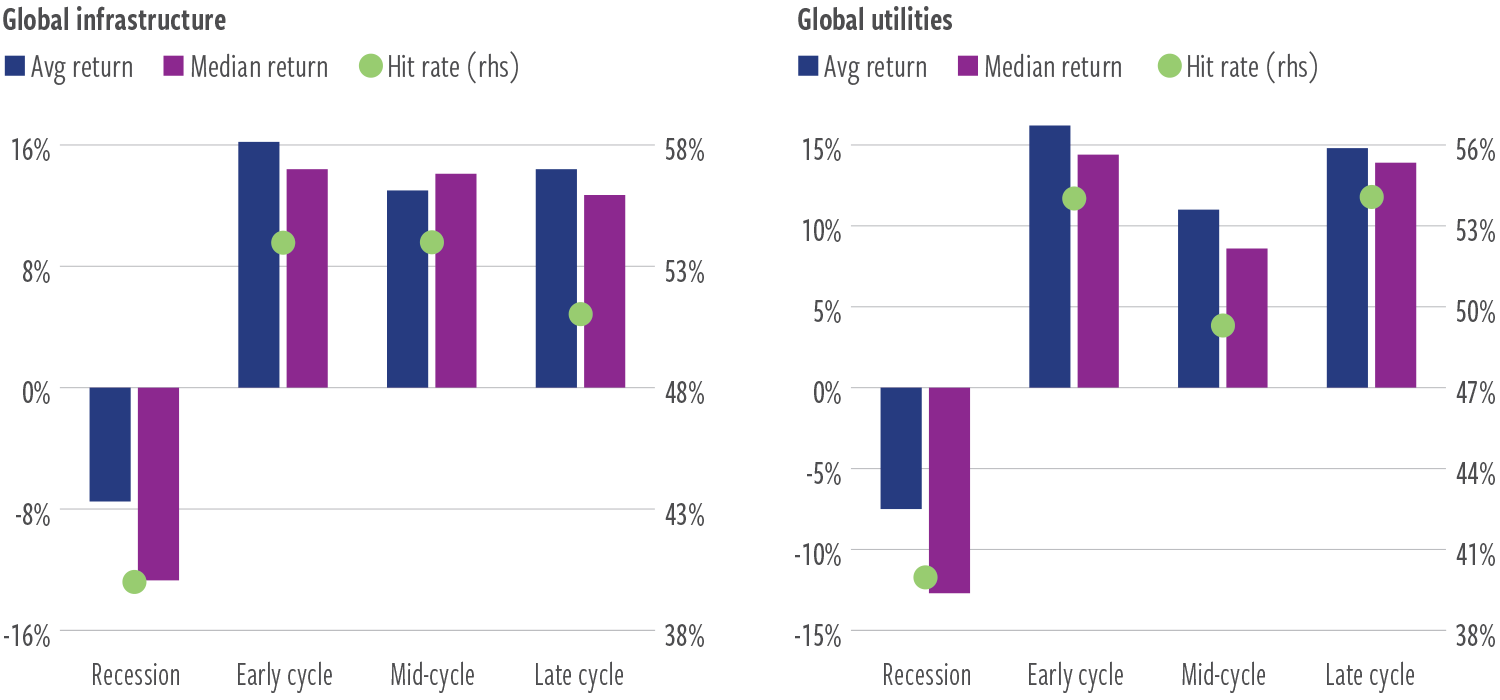
- In the period we studied, infrastructure generally outperformed equities in late-cycle phases, which often coincided with slowing growth and rising inflation pressures as capacity constraints took hold.
- Infrastructure also outperformed in recessionary periods, on average, with water utilities exhibiting particularly strong relative performance.
- Telecoms did better in early/mid-cycle periods.
- Mid-cycle periods were modestly less favorable for infrastructure.
EXHIBIT 1
Business cycle regimes—excess total returns vs. equities, annualized
February 1973–December 2021
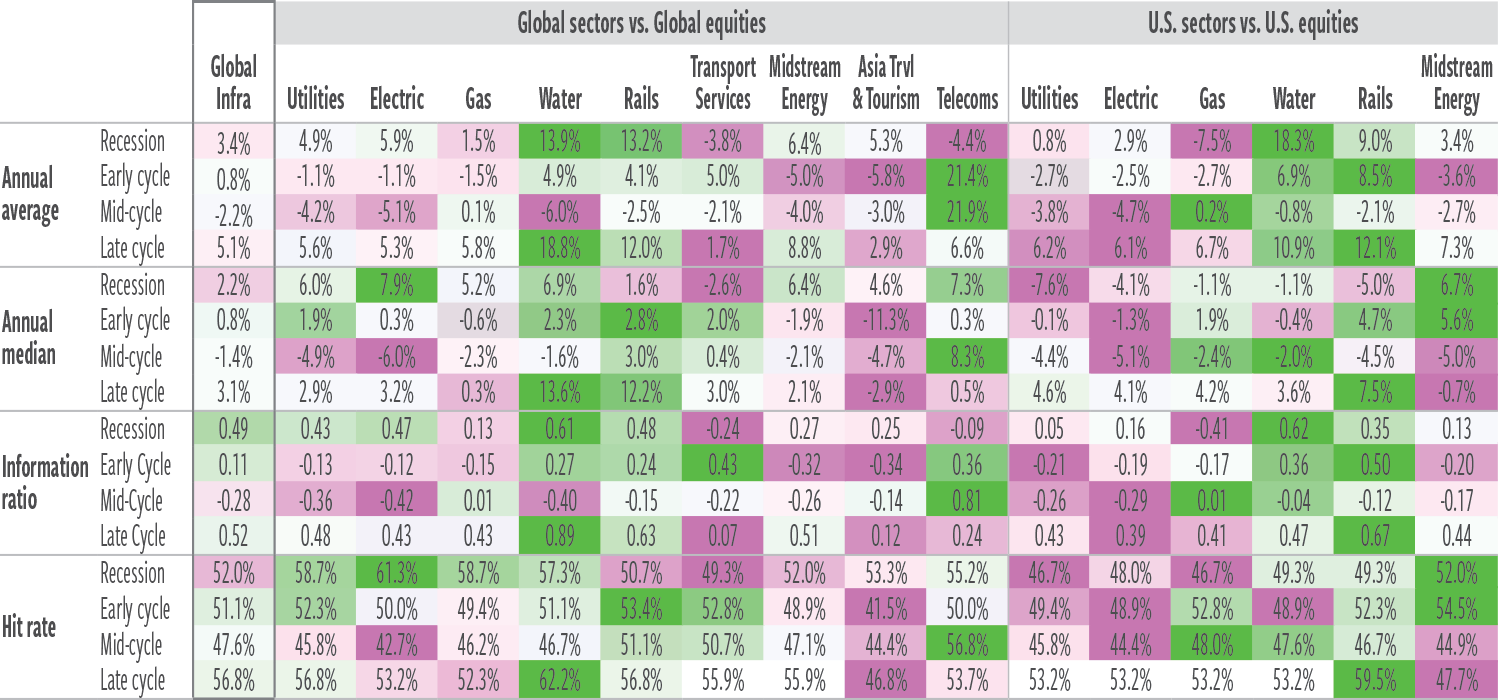
At December 31, 2021. Source: Refinitiv Datastream, Conference Board, Bloomberg, Cohen & Steers analysis.
Past performance is no guarantee of future results. The information presented above does not reflect the performance of any fund or account managed by Cohen & Steers, and there is no guarantee that investors will experience the type of performance reflected above. There is no guarantee that any historical trend illustrated herein will be repeated in the future, and there is no way to predict precisely when such a trend will begin. Recession periods as reported by the National Bureau of Economic Research. Expansion subdivisions determined by Cohen & Steers based on the Conference Board Coincident Index (CBCI): Early cycle—CBCI accelerating sharply; Mid-cycle—CBCI stable; Late cycle—CBCI decelerating. The correlation of the CBCI with the year-over-year change in U.S. gross domestic product (GDP) is 91.7% since the CBCI’s inception in 1960 through December 31, 2021. Telecom index started in 1998. See end notes for index associations, definitions and additional disclosures.
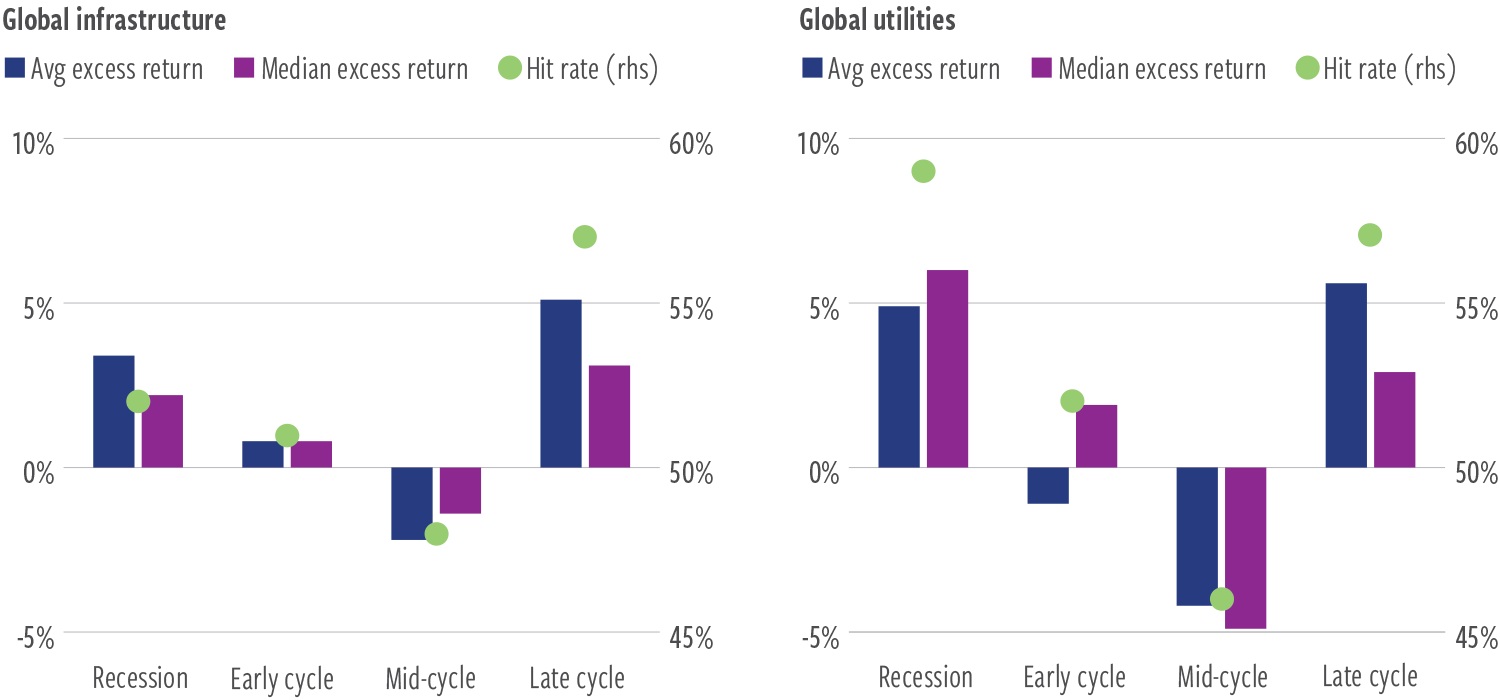
Absolute performance
- Infrastructure had positive returns, on average, during all three expansion phases.
- Unsurprisingly, infrastructure underperformed its long-run average during recessionary periods.
- Rails generated positive overall returns in recessions, an uncommon characteristic for assets with economic sensitivity.
- The underperformance of telecoms in recessions was surprising, but outliers and a small sample set may be the reasons. We expect the subsector to display more defensive characteristics going forward.
Methodology (Exhibits 1–2)
- Historical monthly analysis of infrastructure performance since 1973, conditioning on phases of the business cycle, defined as follows:
- Recessions as reported by the National Bureau of Economic Research; 75 of 587 months (13%)
- Expansion subdivisions determined by Cohen & Steers based on the Conference Board Coincident Index (CBCI):
- Early cycle: CBCI accelerating sharply; 176 of 587 months (30%)
- Mid-cycle: CBCI stable; 225 of 587 months (38%)
- Late cycle: CBCI decelerating; 111 of 587 months (19%)
- See Exhibit 8a for timeline of business cycle phases used in this analysis.
EXHIBIT 2
Business cycle regimes—total returns, annualized
February 1973–December 2021
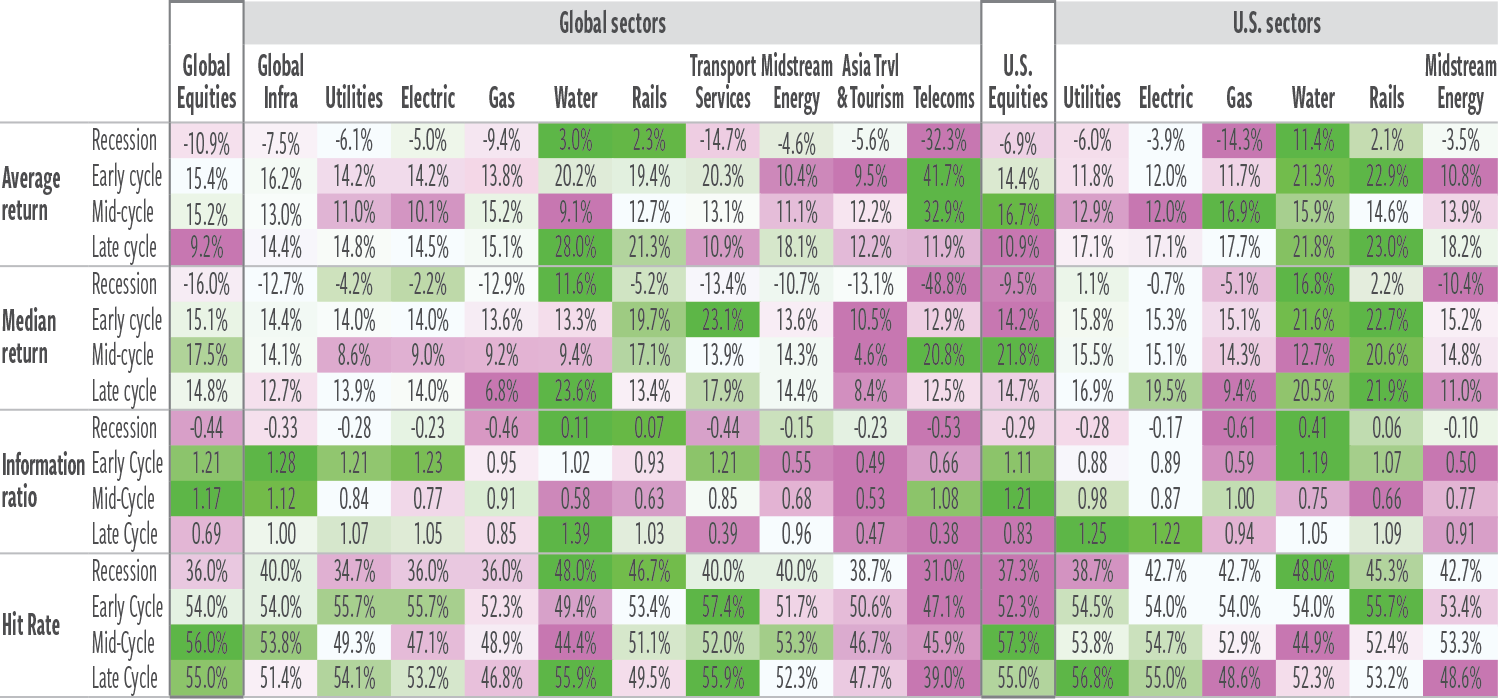
At December 31, 2021. Source: Refinitiv Datastream, Conference Board, Bloomberg, Cohen & Steers analysis.
Past performance is no guarantee of future results. The information presented above does not reflect the performance of any fund or account managed by Cohen & Steers, and there is no guarantee that investors will experience the type of performance reflected above. There is no guarantee that any historical trend illustrated herein will be repeated in the future, and there is no way to predict precisely when such a trend will begin. Recession periods as reported by the National Bureau of Economic Research. Expansion subdivisions determined by Cohen & Steers based on the Conference Board Coincident Index (CBCI): Early cycle—CBCI accelerating sharply; Mid-cycle—CBCI stable; Late cycle—CBCI decelerating. The correlation of the CBCI with the year-over-year change in U.S. gross domestic product (GDP) is 91.7% since the CBCI’s inception in 1960 through December 31, 2021. Telecom index started in 1998. See end notes for index associations, definitions and additional disclosures.
Growth and inflation surprises
There were few “safe havens” in the first half of 2022, as most equities reacted to rapidly accelerating inflation and increased recession risk amid sharp interest-rate hikes. Infrastructure was a notable exception, in keeping with historical trends.
Relative performance vs. equities
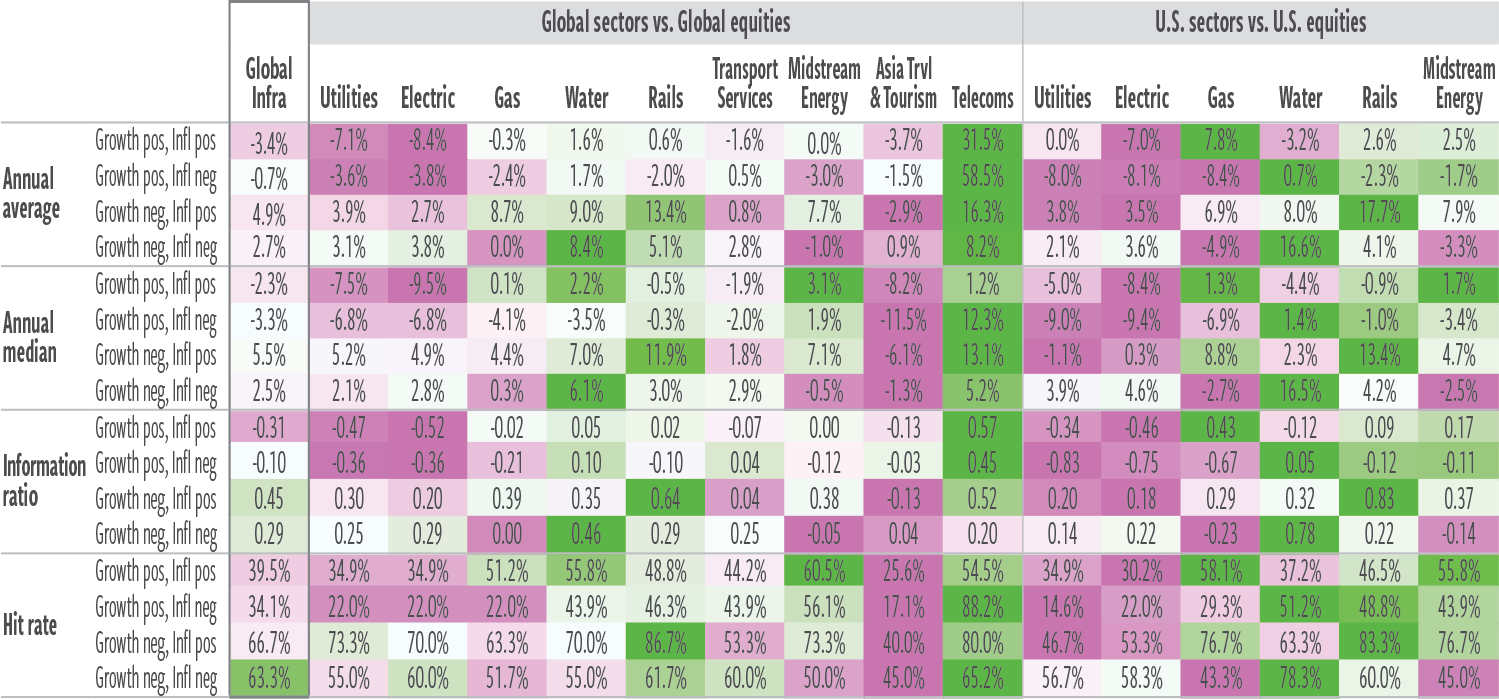
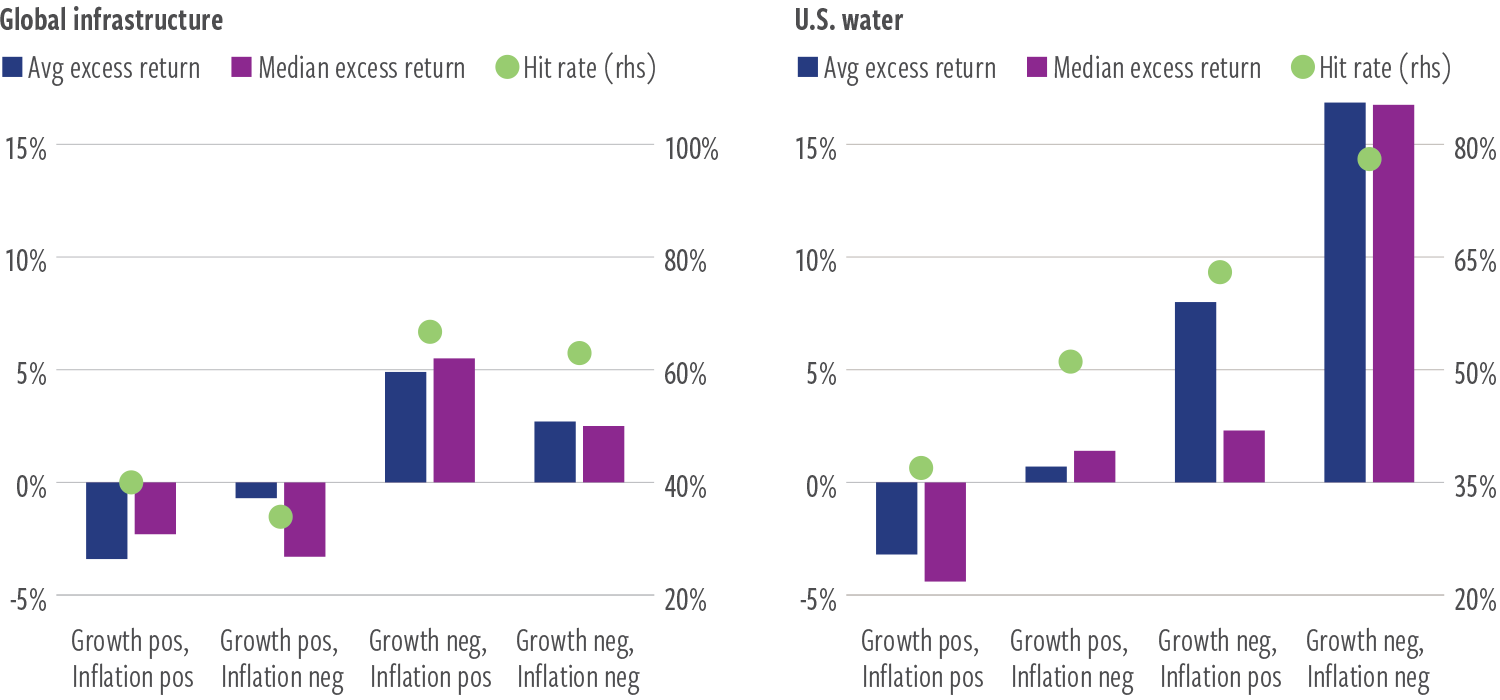
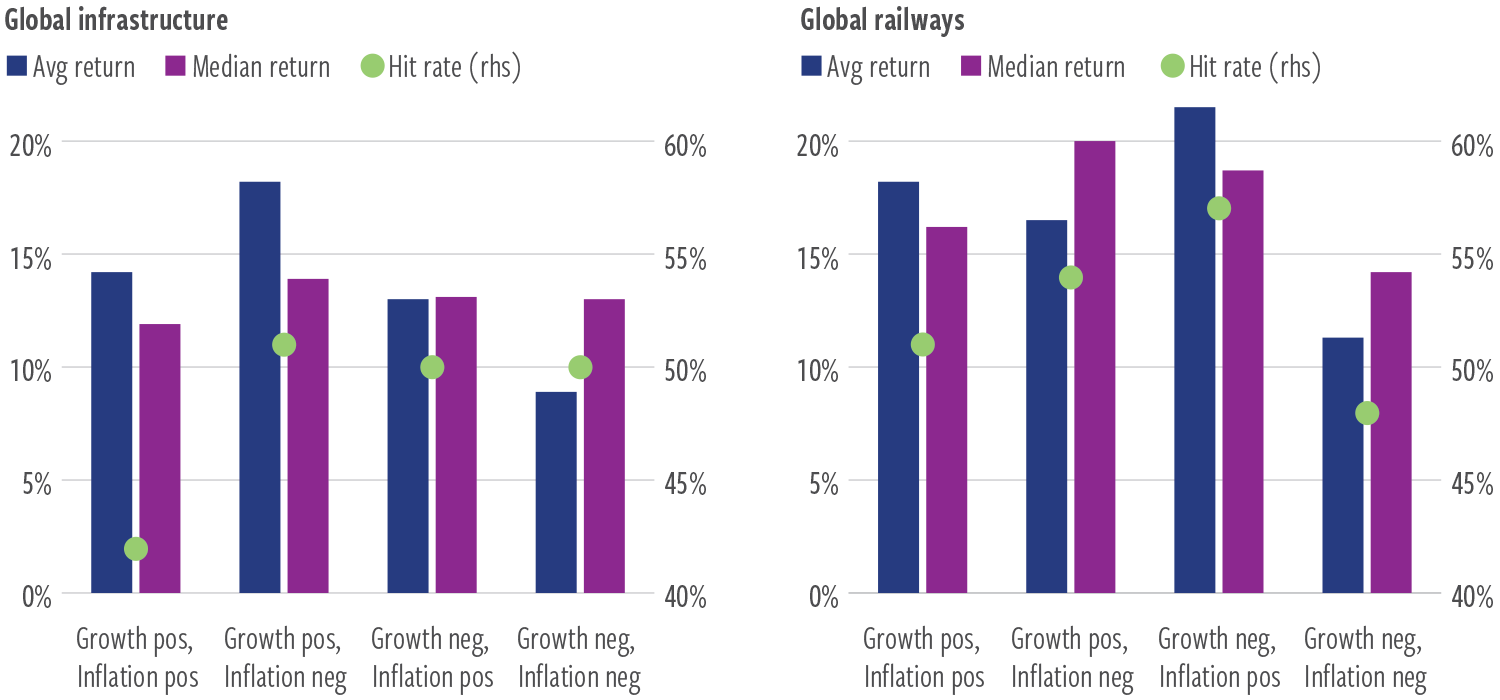
- In the cycles we analyzed, infrastructure showed relative outperformance during periods of slower-than-expected growth and greater-than-expected inflation.
- “Good” inflation, resulting from economic growth and rising demand, generally favors transportation services (such as freight rails and marine ports).
- Persistently high inflation in times of surprisingly slower growth (falling demand) tends to be “bad” inflation but nevertheless favors infrastructure generally.
- Rails tend to act defensively within the industrial transportation space during slowdowns.
- Rails have demonstrated significant pricing power in times of rising inflation due to their monopolistic characteristics and role as an essential service provider to shippers.
EXHIBIT 3
Growth and inflation surprise regimes—excess total returns vs. equities, annualized
January 1979–June 2022
At June 30, 2022. Source: Refinitiv Datastream, Bloomberg, Cohen & Steers analysis.
Past performance is no guarantee of future results. The information presented above does not reflect the performance of any fund or account managed by Cohen & Steers, and there is no guarantee that investors will experience the type of performance reflected above. There is no guarantee that any historical trend illustrated herein will be repeated in the future, and there is no way to predict precisely when such a trend will begin. Growth is measured by the year-over-year change in real (inflation-adjusted) U.S. gross domestic product (GDP). Unexpected growth is measured as the difference between the year-over-year change in real GDP and lagged 1-year-ahead expected change in GDP, as measured by the Philadelphia Federal Reserve Survey of Professional Forecasters 4-quarter-ahead real GDP forecast. Inflation is measured by the year-over-year change in the Consumer Price Index for all urban consumers, published by the U.S. Bureau of Labor Statistics. Unexpected inflation is measured as the difference between the year-over-year realized inflation rate and lagged 1-year-ahead expected inflation, as measured by the University of Michigan survey of 1-year-ahead inflation expectations. Telecom index started in 1998. See end notes for index associations, definitions and additional disclosures.
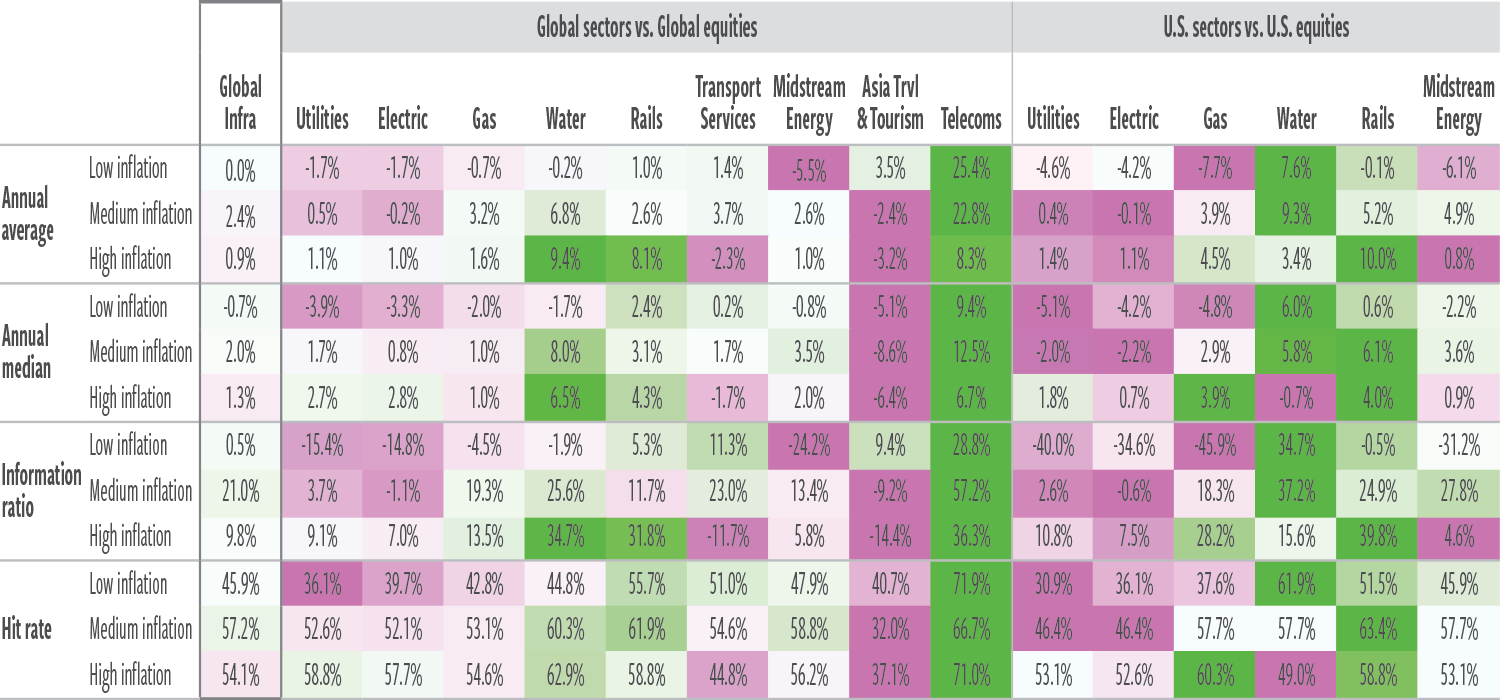
Absolute performance
- U.S. and global utilities present a clear picture of favorable, though somewhat muted, returns in positive-growth-surprise environments.
- When growth surprised to the downside, utilities uniformly outperformed.
- Counterintuitively, transportation services globally showed better performance and hit rates in negative-growth-surprise environments, while lagging in positive-growth-surprise environments.
Methodology (Exhibits 3–4)
- Historical analysis of infrastructure performance since 1979, conditioning on reported U.S. GDP and consumer inflation relative to prior-year expectations.
- Growth positive, inflation positive: 129 of 522 months (25%)
- Growth positive, inflation negative: 123 of 522 months (24%)
- Growth negative, inflation positive: 90 of 522 months (17%)
- Growth negative, inflation negative: 180 of 522 months (34%)
- See Exhibit 8b for timeline of growth and inflation surprise phases used in this analysis.
EXHIBIT 4
Growth and inflation surprise regimes—total returns, annualized
January 1979–June 2022
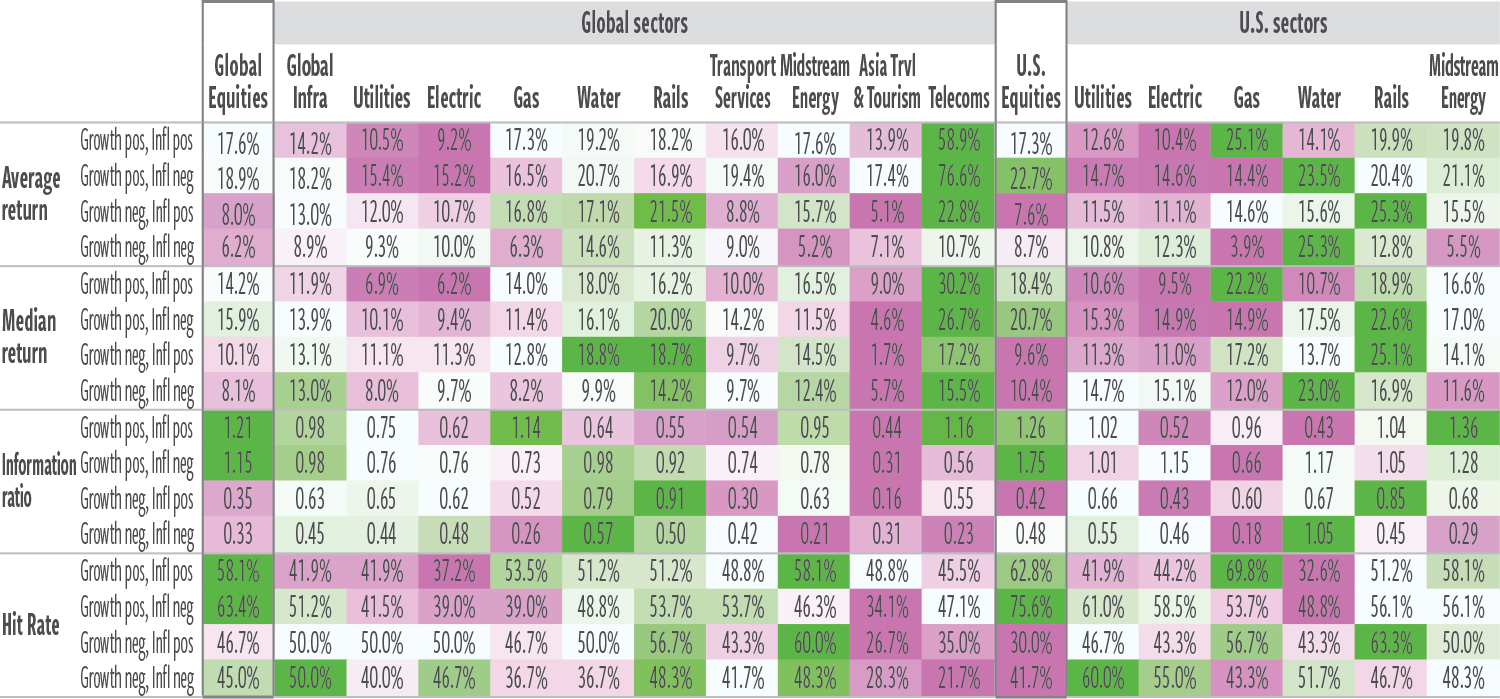
At June 30, 2022. Source: Refinitiv Datastream, Bloomberg, Cohen & Steers analysis.
Past performance is no guarantee of future results. The information presented above does not reflect the performance of any fund or account managed by Cohen & Steers, and there is no guarantee that investors will experience the type of performance reflected above. There is no guarantee that any historical trend illustrated herein will be repeated in the future, and there is no way to predict precisely when such a trend will begin. Growth is measured by the year-over-year change in real (inflation-adjusted) U.S. gross domestic product (GDP). Unexpected growth is measured as the difference between the year-over-year change in real GDP and lagged 1-year-ahead expected change in GDP, as measured by the Philadelphia Federal Reserve Survey of Professional Forecasters 4-quarter-ahead real GDP forecast. Inflation is measured by the year-over-year change in the Consumer Price Index for all urban consumers, published by the U.S. Bureau of Labor Statistics. Unexpected inflation is measured as the difference between the year-over-year realized inflation rate and lagged 1-year-ahead expected inflation, as measured by the University of Michigan survey of 1-year-ahead inflation expectations. Telecom index started in 1998. See end notes for index associations, definitions and additional disclosures.
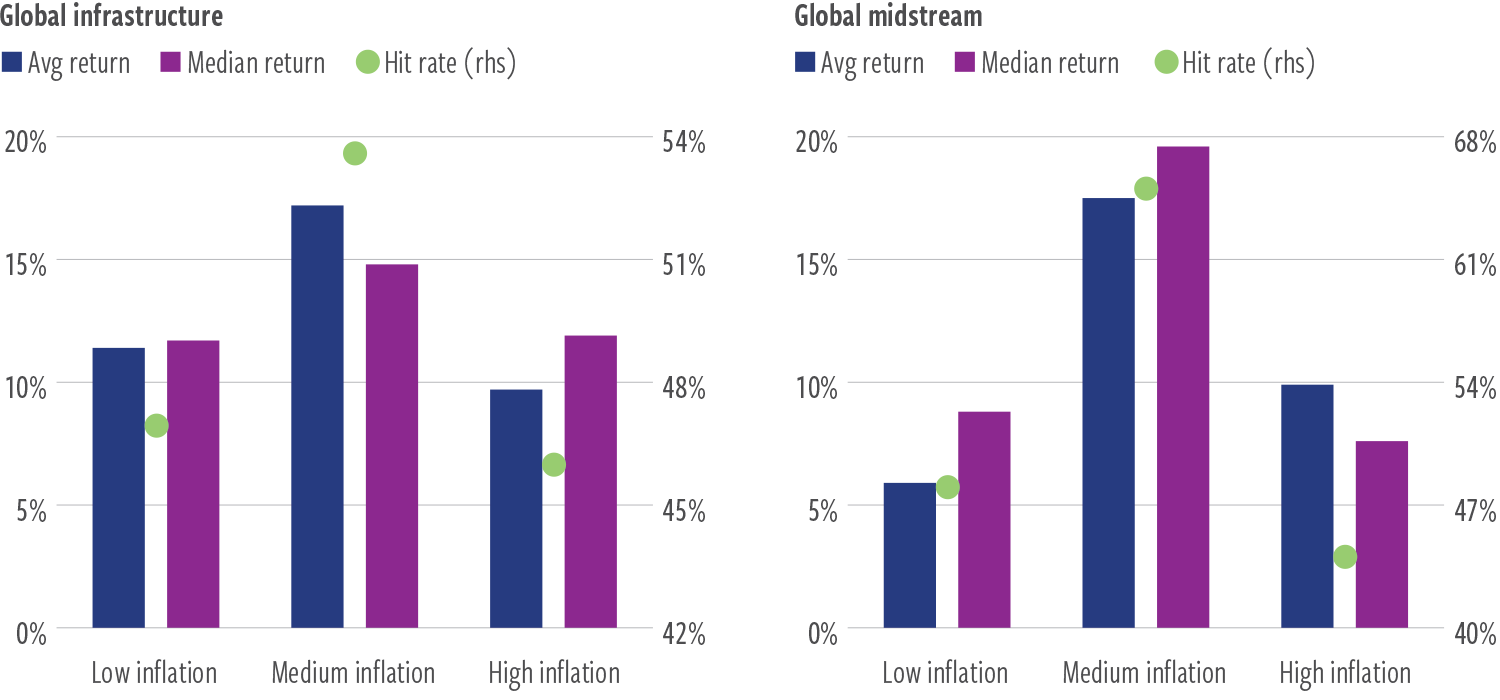
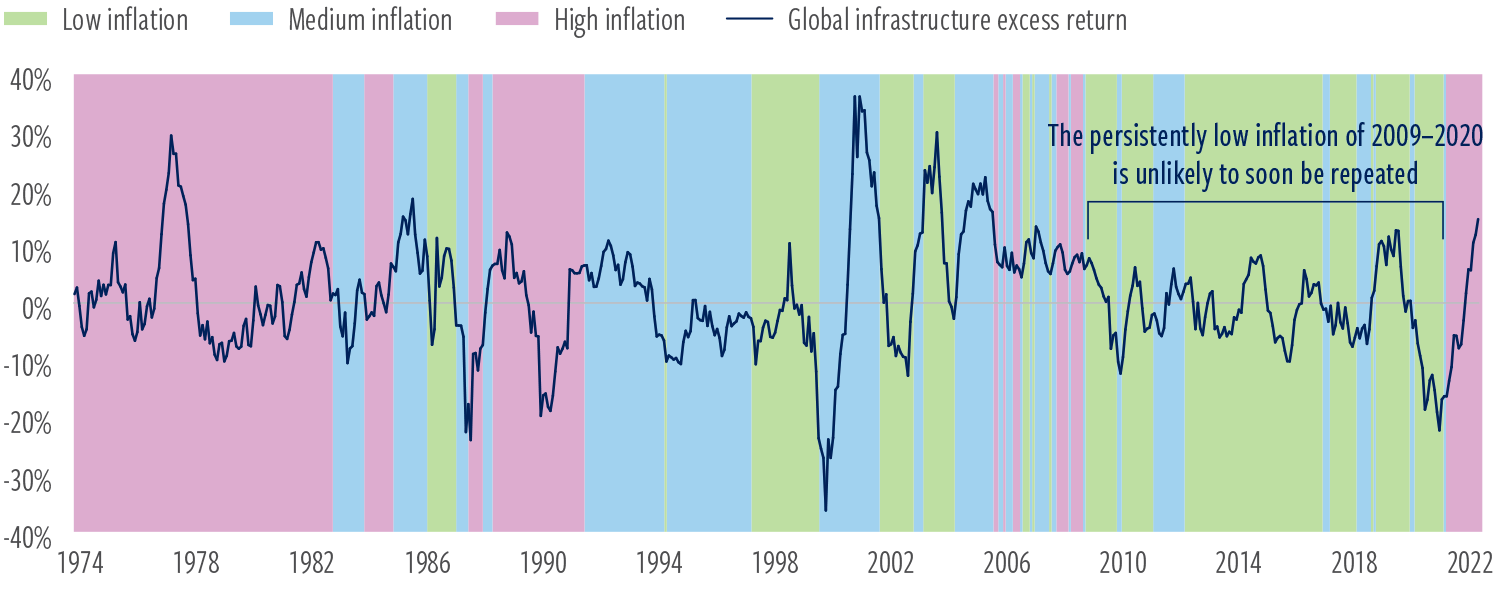
Inflation levels
Infrastructure values have historically held up better than the broad equity market in medium- and high-inflation periods, given the companies’ inflation-linked pricing models and generally inelastic demand for infrastructure services.
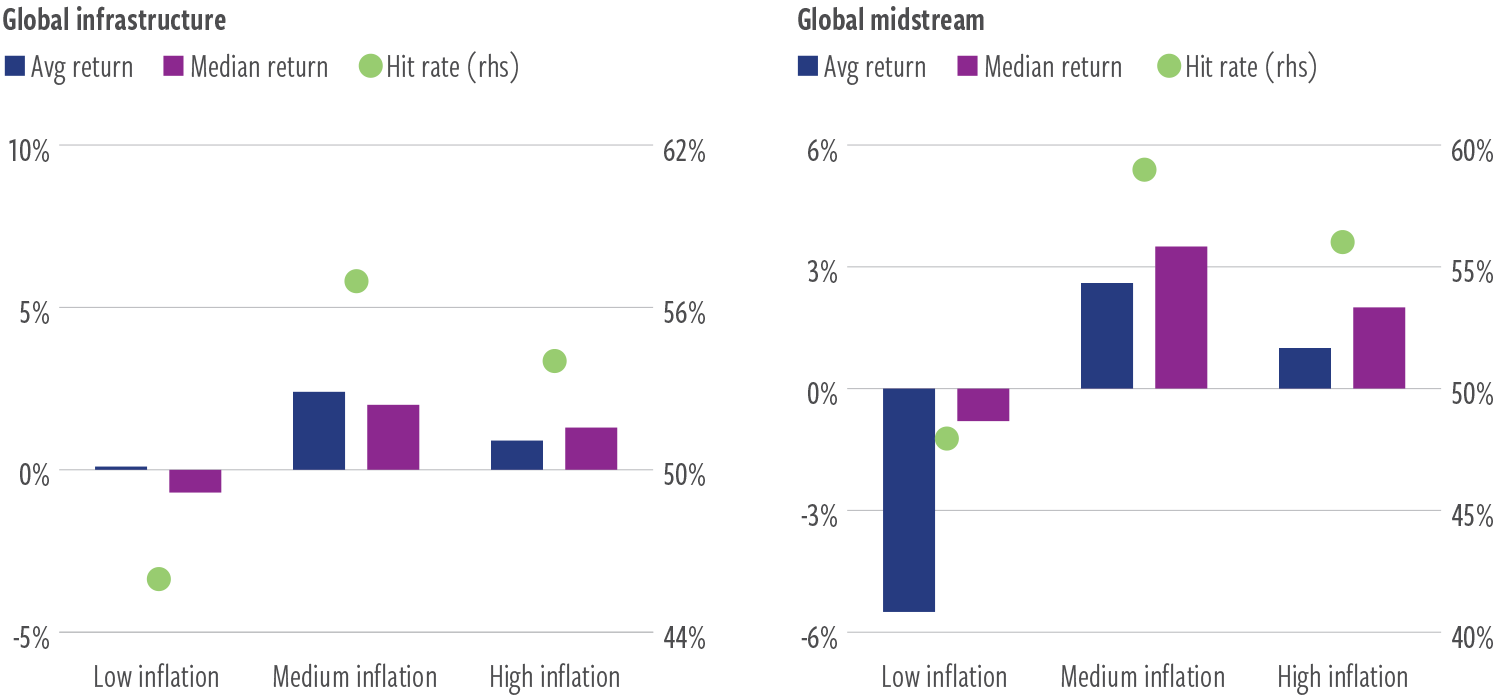
Relative performance vs. equities
- Returns during medium- and high-inflation environments are favorable, with an outsized average annual return under medium-inflation conditions.
- Infrastructure underperformed in low-inflation environments.
- In the prior cycle, inflation remained at a low level for an extended period. We expect inflation in the current cycle to remain elevated.
EXHIBIT 5
Inflation level regimes—excess total returns vs. equities, annualized
February 1973–June 2022
At June 30, 2022. Source: Refinitiv Datastream, Cohen & Steers analysis.
Past performance is no guarantee of future results. The information presented above does not reflect the performance of any fund or account managed by Cohen & Steers, and there is no guarantee that investors will experience the type of performance reflected above. There is no guarantee that any historical trend illustrated herein will be repeated in the future, and there is no way to predict precisely when such a trend will begin. Inflation levels relative to long- term average U.S. headline consumer price index: Low inflation less than 2.4%; medium inflation between 2.4% and 3.9%; high inflation greater than 3.9%. Telecom index started in 1998. See end notes for index associations, definitions and additional disclosures.
Absolute performance
- For idiosyncratic reasons (not likely to be repeated with the business model currently in use), midstream energy does not show up as an outperformer relative to other subsectors, at any level of inflation.
- However, among infrastructure subsectors, we expect midstream to have the most sensitivity to absolute levels of inflation going forward.
- Asia travel & tourism was less responsive than other sectors to medium and high U.S. inflation.
Methodology (Exhibits 5–6)
- Historical analysis of infrastructure performance since 1973, conditioning on headline U.S. consumer inflation relative to its long-term average.
- Low inflation (<2.4% headline CPI): 194 of 582 months (33%)
- Medium inflation (2.4%–3.9% CPI): 194 of 582 months (33%)
- High inflation (>3.9% CPI): 194 of 582 months (33%)
- See Exhibit 8c for timeline of inflation regimes used in this analysis.
EXHIBIT 6
Inflation level regimes—total returns, annualized
February 1973–June 2022
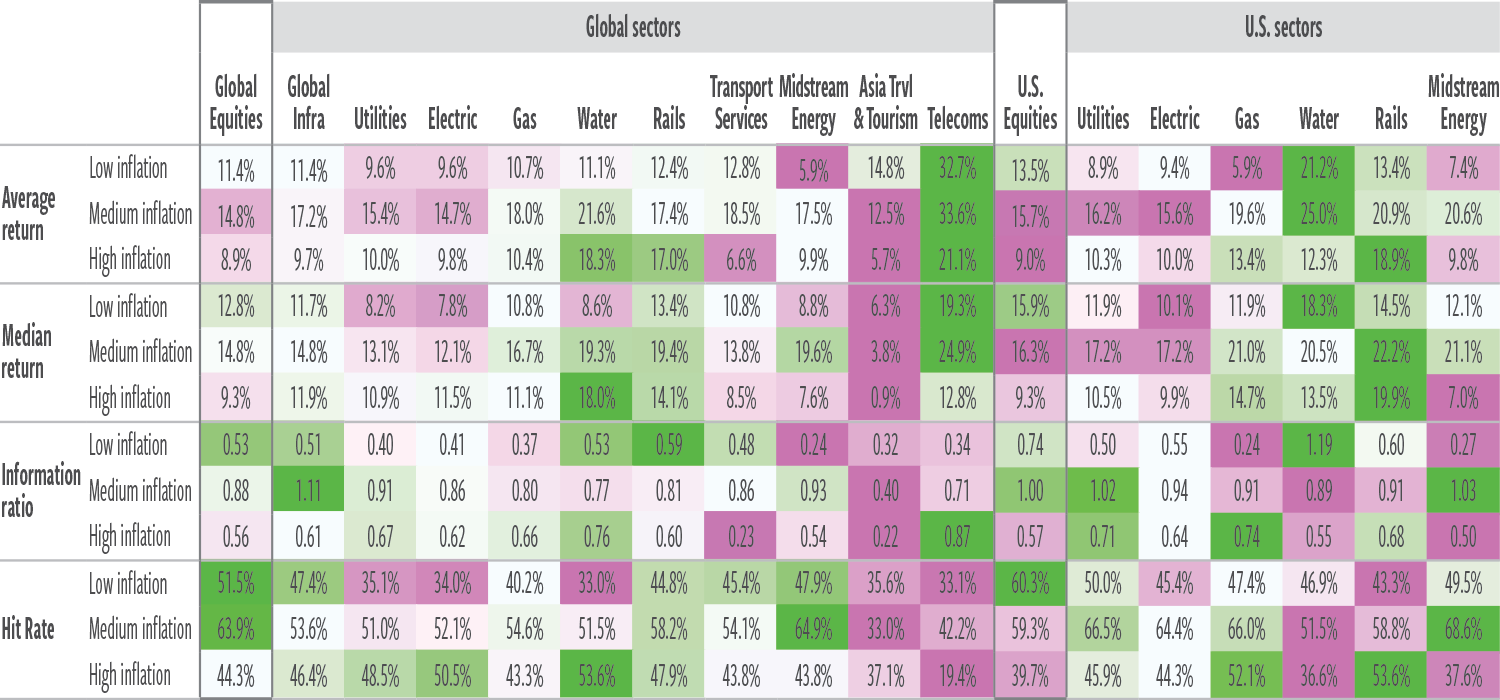
At June 30, 2022. Source: Refinitiv Datastream, Cohen & Steers analysis.
Past performance is no guarantee of future results. The information presented above does not reflect the performance of any fund or account managed by Cohen & Steers, and there is no guarantee that investors will experience the type of performance reflected above. There is no guarantee that any historical trend illustrated herein will be repeated in the future, and there is no way to predict precisely when such a trend will begin. Inflation levels relative to long- term average U.S. headline consumer price index: Low inflation less than 2.4%; medium inflation between 2.4% and 3.9%; high inflation greater than 3.9%. Telecom index started in 1998. See end notes for index associations, definitions and additional disclosures.
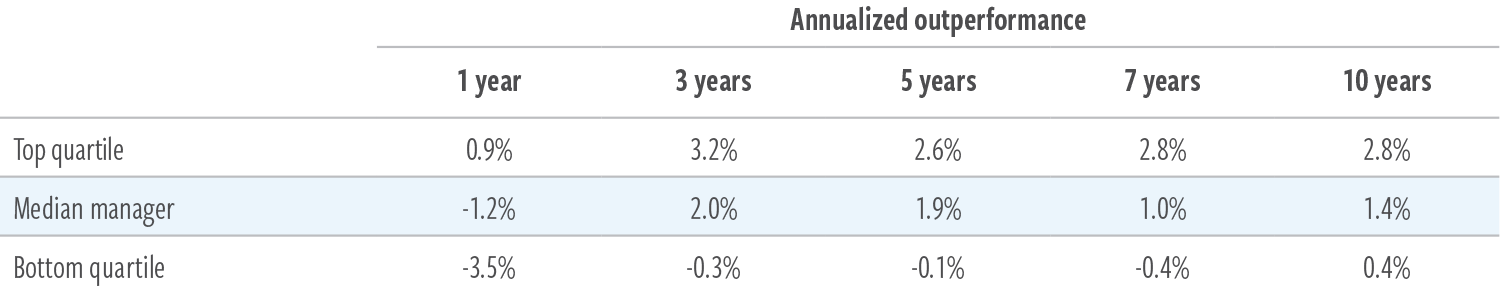
The case for active management
Listed infrastructure represents a diverse opportunity set that has historically produced a wide dispersion of subsector returns in any given period depending on economic drivers. Anticipating such trends is a key component of active management, and active managers of listed infrastructure have consistently demonstrated a track record of delivering value for investors (Exhibit 7).
Managers may capitalize on distinct economically driven sector characteristics as well as secular trends (such as clean energy initiatives or increasing data intensity with the adoption of 5G technology). Active managers may also take advantage of pricing anomalies that occur due to changes in interest rates and other technical drivers, or from shifting regulatory and political factors.
By contrast, passive portfolios are unable to allocate assets to capitalize on macro factor or secular growth opportunities. Nor can they sidestep sectors that may be facing headwinds. (Of course, there is no guarantee that active management can successfully navigate these trends.)
EXHIBIT 7
Active management has provided a source of alpha
Relative performance of global active listed infrastructure managers versus benchmark(a)
At June 30, 2022. Source: eVestment.
Data quoted represents past performance, which is no guarantee of future results. (a) Manager preferred benchmark as detailed in eVestment. The information presented above does not reflect the performance of any fund or account managed by Cohen & Steers, and there is no guarantee that investors will experience the type of performance reflected above. There is no guarantee that any historical trend illustrated above will be repeated in the future, and there is no way to predict precisely when such a trend will begin. An investor cannot invest directly in an index and index performance does not reflect the deduction of any fees, expenses or taxes. Index comparisons have limitations as volatility and other characteristics may differ from a particular investment. There is no guarantee that an active investment strategy will outperform the broader market index. See end notes for additional disclosures.
Appendix
Timelines of the examined regimes
The charts below display the rolling 12-month excess returns of listed infrastructure relative to global equities across the macro environments examined in this presentation.
EXHIBIT 8a
Business cycle phases (see Exhibits 1 & 2)
January 1974–December 2021, monthly data
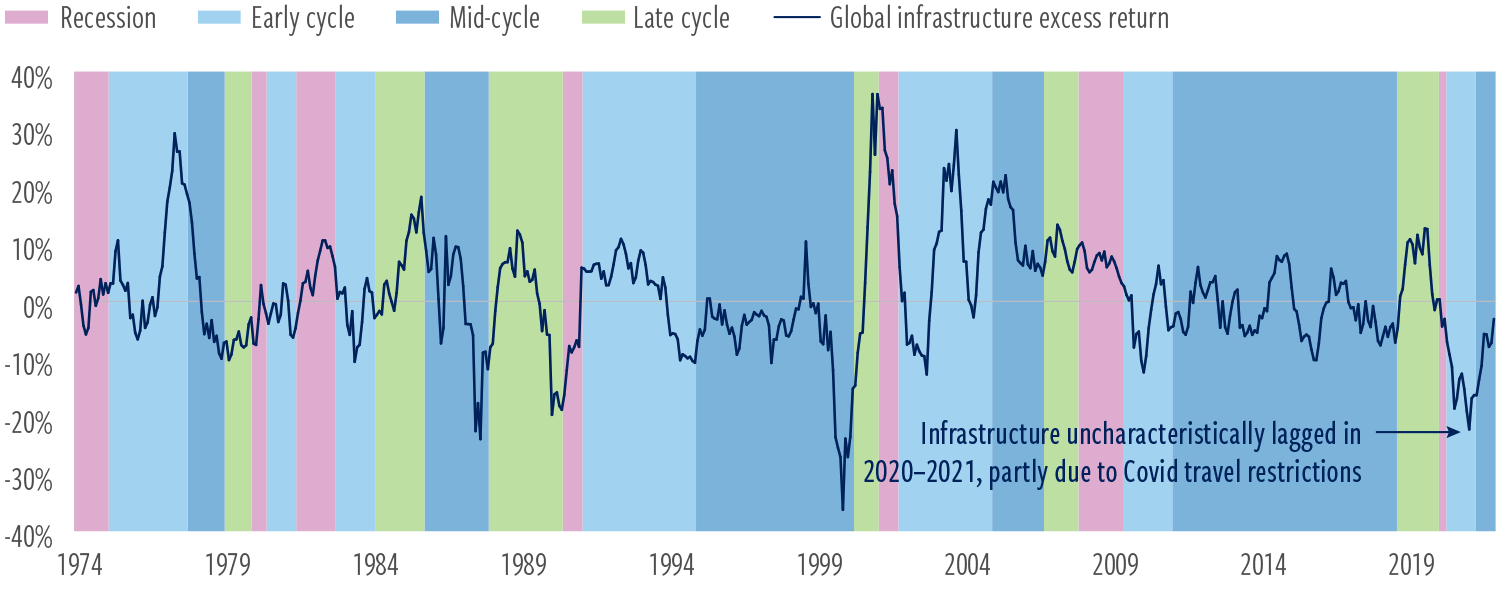
EXHIBIT 8b
Growth & inflation surprises (see Exhibits 3 & 4)
January 1979–June 2022, quarterly data
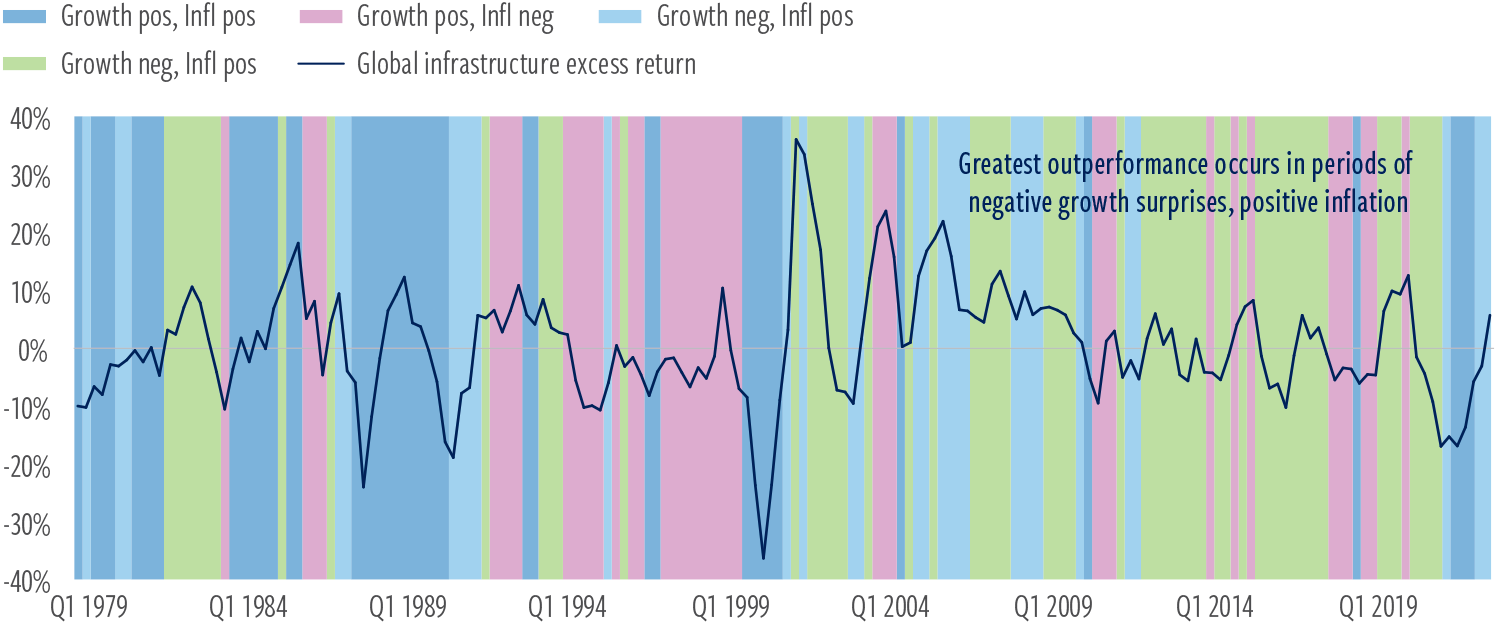
EXHIBIT 8c
Inflation levels (see Exhibits 5 & 6)
January 1974–June 2022, monthly data
At June 30, 2022, unless otherwise noted. Source: Refinitiv Datastream, Conference Board, Bloomberg, Cohen & Steers analysis.
Past performance is no guarantee of future results. The information presented above does not reflect the performance of any fund or account managed by Cohen & Steers, and there is no guarantee that investors will experience the type of performance reflected above. There is no guarantee that any historical trend illustrated herein will be repeated in the future, and there is no way to predict precisely when such a trend will begin. Business cycle: Recession periods as reported by the National Bureau of Economic Research. Expansion subdivisions determined by Cohen & Steers based on the Conference Board Coincident Index (CBCI): Early cycle—CBCI accelerating sharply; Mid-cycle—CBCI stable; Late cycle—CBCI decelerating. The correlation of the CBCI with the year-over-year change in U.S. gross domestic product (GDP) is 91.7% since the CBCI’s inception in 1960 through June 30, 2022. Growth and inflation surprises: Growth is measured by the year-over-year change in real (inflation-adjusted) U.S. gross domestic product (GDP). Unexpected growth is measured as the difference between the year-over-year change in real GDP and lagged 1-year- ahead expected change in GDP, as measured by the Philadelphia Federal Reserve Survey of Professional Forecasters 4-quarter-ahead real GDP forecast. Inflation is measured by the year-over-year change in the Consumer Price Index for all urban consumers, published by the U.S. Bureau of Labor Statistics. Unexpected inflation is measured as the difference between the year-over-year realized inflation rate and lagged 1-year-ahead expected inflation, as measured by the University of Michigan survey of 1-year-ahead inflation expectations. Inflation level: Inflation levels relative to long-term average U.S. headline consumer price index: low inflation less than 2.4%; medium inflation between 2.4% and 3.9%; high inflation greater than 3.9%. See end notes for additional disclosures.
ABOUT THE AUTHORS

Benjamin Morton, Executive Vice President, is Head of Global Infrastructure and a senior portfolio manager for Cohen & Steers’ infrastructure portfolios, including those focused on master limited partnerships.

John Muth, Senior Vice President, is the firm’s Macro Strategist responsible for global economic outlooks and macro research across the firm.
Index definitions and important disclosures
An investor cannot invest directly in an index and index performance does not reflect the deduction of any fees, expenses or taxes. Index comparisons have limitations as volatility and other characteristics may differ from a particular investment.
Global listed infrastructure: The Datastream World Index Series consists of free-float-adjusted, market-capitalization-weighted global and regional indexes of companies in their respective sectors (Utilities, Rails, Transportation Services, Pipelines (midstream energy) and Travel & Tourism), compiled by Refinitiv Datastream. Electric, Gas and Water are subsets of Utilities. Telecoms represented by a custom capitalization-weighted index consisting of AMT, CCI, SBAC and SESG beginning 1998. These sector-level indices have a longer time series than the FTSE Global Core Infrastructure 50/50 Total Return Index (FGCIICUT), which allows analysis of a continuous index back to 1973. Global listed infrastructure overall performance represented by a market- capitalization-weighted aggregate of sector indexes. This index exhibited a 96.4% correlation to the FGCIICUT since the latter’s inception in 2006, based on 1-month total returns over this sample.
Global Equities: Refinitiv Datastream Global Equities index is a free-float-adjusted, market-capitalization-weighted index designed to serve as a broad market benchmark to track the performance of liquid equities worldwide.
U.S. Equities: Refinitiv Datastream U.S. Equities Index is a free-float-adjusted, market-capitalization-weighted index designed to serve as a broad market benchmark to track the performance of liquid equities in the U.S.
This document is provided to qualified institutional and professional investors or their advisors only for informational purposes and reflects prevailing conditions and our judgment as of this date, which are subject to change. It does not constitute investment advice or a recommendation or offer. We consider the information in this presentation to be accurate, but we do not represent that it is complete or should be relied upon as the sole source of appropriateness for investment. Past results are not necessarily indicative of future results. There is no guarantee that any historical trend illustrated above will be repeated in the future, and there is no way to predict precisely when such a trend will begin. The views and opinions are as of the date of publication and are subject to change without notice. Risks involved with investment, including potential loss of capital, should be carefully considered. Diversification does not ensure a profit or protect against loss. There is no guarantee that an actively managed strategy will outperform the broader market index.
No representation or warranty is made as to the efficacy of any strategy or fund or the actual returns that may be achieved.
Risks of investing in global infrastructure securities. Infrastructure issuers may be subject to regulation by various governmental authorities and may also be affected by governmental regulation of rates charged to customers, operational or other mishaps, tariffs, and changes in tax laws, regulatory policies, and accounting standards. Foreign securities involve special risks, including currency fluctuation and lower liquidity. Some global securities may represent small and medium-sized companies, which may be more susceptible to price volatility than larger companies. No representation or warranty is made as to the efficacy of any particular strategy or fund or to the actual returns that may be achieved.
Cohen & Steers Capital Management, Inc. (Cohen & Steers) is a U.S. registered investment advisory firm that provides investment management services to corporate retirement, public and union retirement plans, endowments, foundations and mutual funds. Cohen & Steers UK Limited is authorized and regulated by the Financial Conduct Authority (FRN458459). Cohen & Steers Japan Limited is a registered financial instruments operator (investment advisory and agency business and discretionary investment management business with the Financial Services Agency of Japan and the Kanto Local Finance Bureau No. 3157) and is a member of the Japan Investment Advisers Association. Cohen & Steers Asia Limited is authorized and regulated by the Securities and Futures Commission of Hong Kong (ALZ367). Cohen & Steers Ireland Limited is regulated by the Central Bank of Ireland (No.C188319).
For readers in the Middle East: This document is for informational purposes only. It does not constitute or form part of any marketing initiative, any offer to issue or sell, or any solicitation of any offer to subscribe or purchase, any products, strategies or other services, nor shall it or the fact of its distribution form the basis of, or be relied on in connection with, any contract resulting therefrom. In the event that the recipient of this document wishes to receive further information with regard to any products, strategies or other services, it shall specifically request the same in writing from us.