
A reset in private real estate has occurred at a time when allocations to other asset classes are less and less attractive.
KEY TAKEAWAYS
- Prices have reset
Commercial real estate prices have bottomed, creating an entry point into an asset class that has provided steady income, capital appreciation and tax efficiency. - Limited supply meets resilient demand
Higher borrowing and construction costs have slowed new supply, demand remains resilient for most property types, and the overall backdrop is favorable for CRE. - Stocks, private credit less attractive
With the sustained period of ultra- low rates behind us, other asset classes are less attractive. Equities (listed and private) are at historically high valuations. Credit spreads are near historical lows. Private credit is showing some cracks.
Commercial real estate prices have bottomed
Their price decline of 20% on average, peak to trough, was driven by 10 rate hikes in 2022 and 2023 that moved markets out of nearly a decade of near- zero rates and into a significantly higher cost of capital.
The resulting reset in private real estate is now an entry point for investors into an asset class that has historically provided steady income, capital appreciation and tax efficiency—at a time when other allocations are less and less attractive.
Equities (listed and private) are at historically high valuations, and listed returns are increasingly concentrated in a handful of companies benefiting from an AI-driven surge. Credit spreads are near historical lows, leaving little cushion if defaults rise or economic conditions worsen.
With the sustained period of ultra-low rates now behind us, we view those markets as having more downside than upside. Private credit, in particular, is beginning to show some cracks, in the form of concerns about stretched valuations, deteriorating underwriting standards, and elevated defaults on the back of several high-profile challenges.
Private real estate, by comparison, has repriced. U.S. private real estate, as measured by the NCREIF-ODCE index, has now posted five consecutive quarters of positive returns. This followed negative returns for seven straight quarters, dating back to the end of 2022.
Private real estate, due to its appraisal-based valuations, does not adjust to new market conditions as quickly as listed real estate, taking much longer to reprice. But once it does, it tends to build lasting momentum. The consistency of these positive returns suggests that we’re not just seeing a temporary bounce, but rather that the bottom of the market has been established.
EXHIBIT 1
Core private real estate has bottomed
Quarterly and cumulative return since peak in 3Q 2022(a)
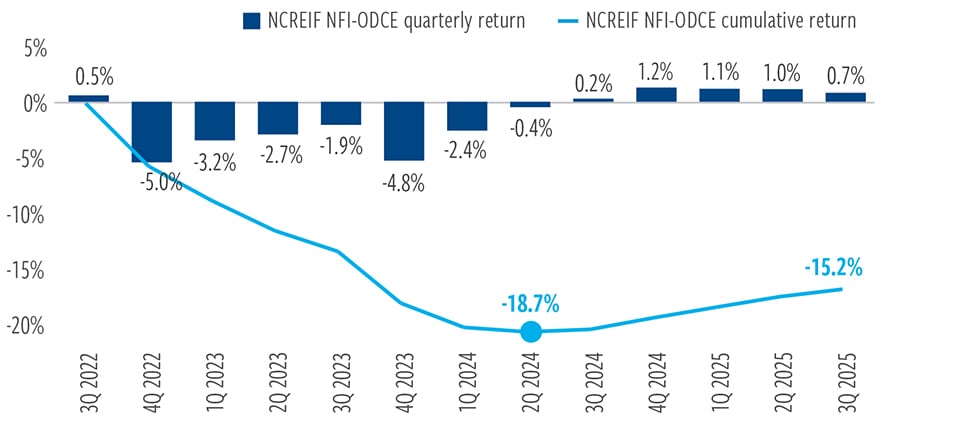
September 30, 2025. Source: NCREIF, Morningstar Direct, Cohen & Steers.
Past performance is no guarantee of future results. There is no guarantee that any historical trend illustrated above will be repeated in the future, and there is no way to predict precisely when such a trend will begin. The information presented above does not reflect the performance of any fund or other account managed or serviced by Cohen & Steers, and there is no guarantee that investors will experience the type of performance reflected above. (a) ODCE is represented by the NCREIF Fund Index—Open-End Diversified Core Equity Index (NFI-ODCE) – Gross Total Returns.
This pattern points to an emerging opportunity. There have only been three commercial real estate downturns since 1978. Each of the first two was followed by strong returns, and , while there are no guarantees, we expect similar results this time. This aligns with the pattern that once returns turn positive in commercial real estate, they remain positive, especially as the effects of the Fed easing cycle take hold.
EXHIBIT 2
Previous downturns were followed by sustained strong returns
NCREIF Property Index: Historical and average returns after negative years(a)
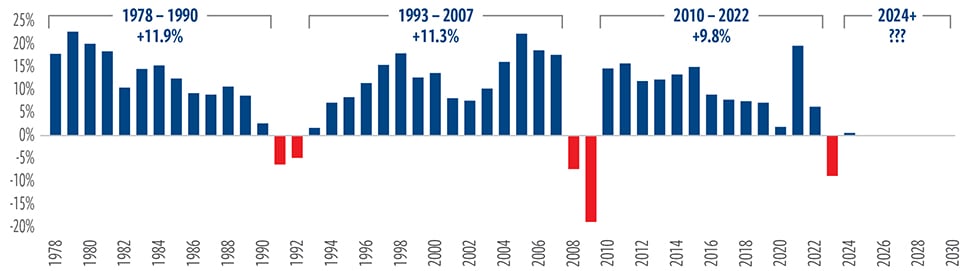
At December 31, 2024. Source: NCREIF, Cohen & Steers.
Data quoted represents past performance, which is no guarantee of future results. The information presented above does not reflect the performance of any fund or account managed or serviced by Cohen & Steers, and there is no guarantee that investors will experience the type of performance reflected above. There is no guarantee that any historical trend illustrated above will be repeated in the future, and there is no way to predict precisely when such a trend might begin. An investor cannot invest directly in an index, and index performance does not reflect the deductions of any fees, expenses or taxes. (a) Total returns represented by the NCREIF Property Index (NPI) gross returns. Total returns calculations are based on quarterly returns before deduction of investment management fees. The NCREIF Property Index is a quarterly, unleveraged composite total return for private commercial real estate properties held for investment purposes only; all properties in the index have been acquired, at least in part, on behalf of tax-exempt institutional investors and held in a fiduciary environment.
And while some sectors repriced ahead of others, evidence shows that private real estate has likely bottomed across the board. Retail hit its lows first, late in 2023. Industrial followed in late 2023, while multi-family apartments and office fell further and longer, bottoming in 1Q24 and 4Q24, respectively.
EXHIBIT 3
Values have stabilized across property sectors
Cumulative return since peak in 3Q 2022
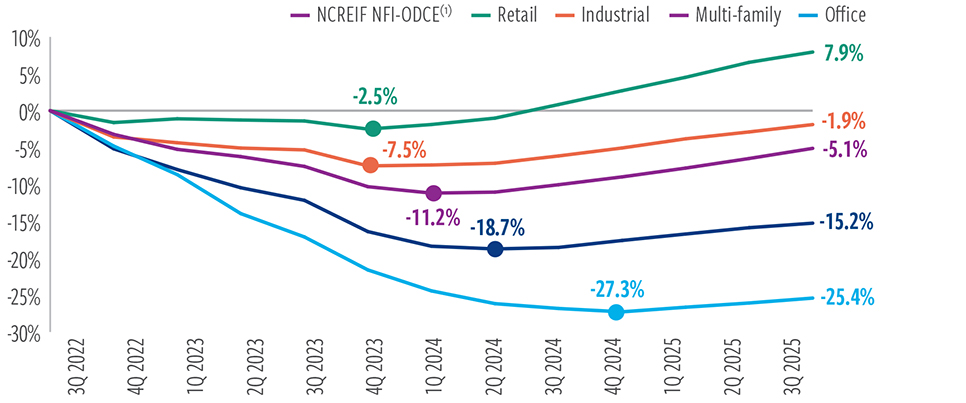
At September 30, 2025. Source: NCREIF, Morningstar Direct, Cohen & Steers.
Past performance is no guarantee of future results. There is no guarantee that any historical trend illustrated above will be repeated in the future, and there is no way to predict precisely when such a trend will begin. The information presented above does not reflect the performance of any fund or other account managed or serviced by Cohen & Steers, and there is no guarantee that investors will experience the type of performance reflected above. (a) ODCE is represented by the NCREIF Fund Index—Open-End Diversified Core Equity Index (NFI-ODCE) – Gross Total Returns.
This doesn’t mean that the tide will rise or rise at the same rate for all property types from here. We believe retail is situated to reaccelerate from current levels, though not blindly across the board. Property selection will matter, as property types, business models, locations and valuations vary.
Still, we see opportunities driven by supply and demand dynamics that favor expected returns for commercial real estate. While some property types have been more constrained than others, economic uncertainty, higher borrowing costs, and inflationary pressures on building costs (notably, materials and wages) have slowed new construction.
Inflation on materials and labor, combined with higher borrowing costs, mean that it simply costs more to build than to buy, and this disincentive to build will enable accelerating rent growth for existing properties. Mortenson’s Construction Cost Index shows that nonresidential construction costs have climbed more than 40% since 2020 and are up nearly 7% in just the last 12 months.
The result is that new supply isn’t coming any time soon. Given that real estate prices tend to track replacement costs, we view the current data as a strong buy signal.
EXHIBIT 4
It is now cheaper to buy than build
Commercial property price return vs. real property replacement cost (index=100)(a)
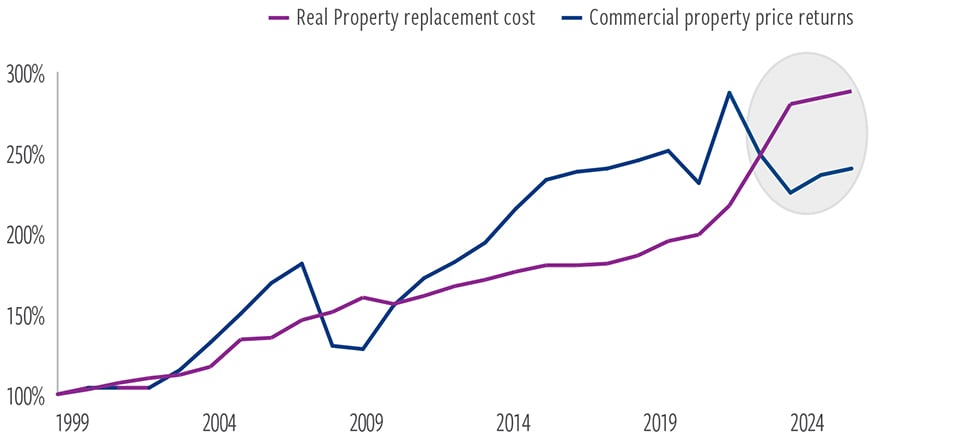
At September 30, 2025. Source: Zurich, Green Street, Cohen & Steers.
Past performance is no guarantee of future results. There is no guarantee that any historical trend illustrated above will be repeated in the future, and there is no way to predict precisely when such a trend will begin. The information presented above does not reflect the performance of any fund or other account managed or serviced by Cohen & Steers, and there is no guarantee that investors will experience the type of performance reflected above. (a) Real property replacement cost represented by Zurich Replacement Value Cost Trends, January 2025. The cost trends are published to assist in maintaining proper levels of insurable replacement costs for commercial and industrial properties. Commercial property price returns are represented by Green Street’s Commercial Property Price Index (CPPI). Green Street’s CPPI is a proprietary time series of U.S. commercial property values that captures the prices at which commercial real estate transactions are currently being negotiated and contracted.
In fact, U.S. construction starts for every major property type were below their 10-year average in 2024 and 2025 (year to date at November 25).
EXHIBIT 5
Tight supply should drive “rent growth”
U.S. construction starts vs. 10-year average by sector (% of inventory)
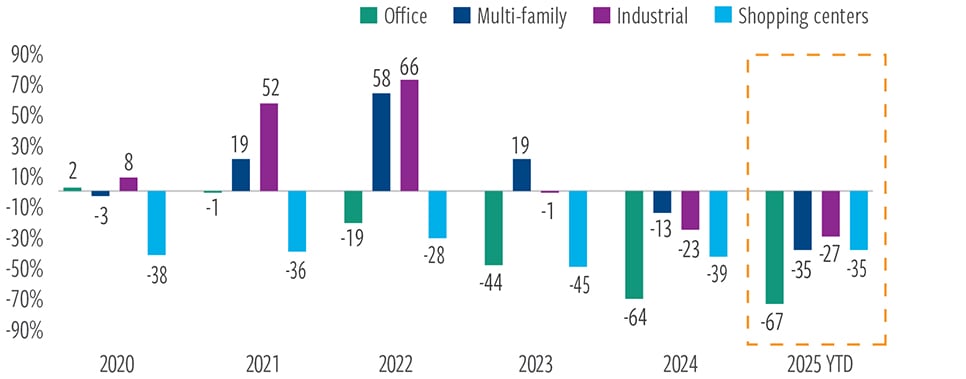
At November 25, 2025. Source: CoStar, Cohen & Steers.
Data quoted represents past performance, which is no guarantee of future results.
We expect that lower supply and resilient demand will drive accelerating fundamentals and property values for commercial real estate. This is emerging, we believe, in a recent uptick in transaction volumes.
EXHIBIT 6
Accelerating fundamentals support recovery
Growth in market revenue per available foot (measured by market rents and occupancy rates)(a)
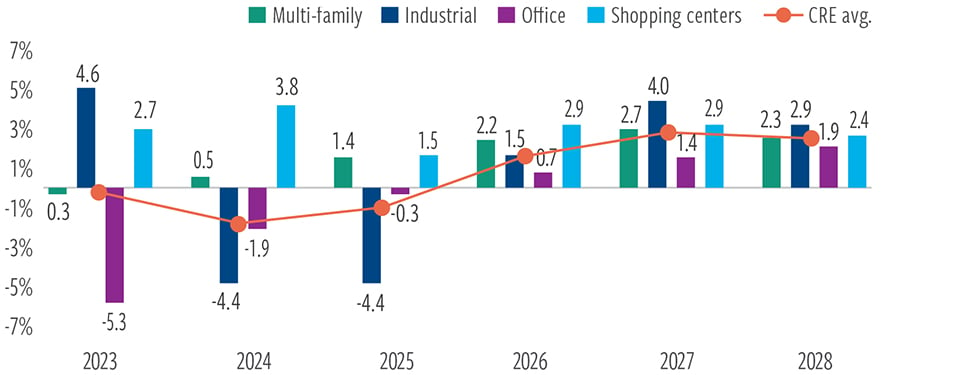
At September 30, 2025. Source: NCREIF, Cohen & Steers.
Data quoted represents past performance, which is no guarantee of future results. The information presented above does not represent the performance of any fund or other account managed or serviced by Cohen & Steers, and there is no guarantee that investors will experience the type of performance listed above. There is no guarantee that any historical trend illustrated above will be repeated in the future, and there is no way to predict precisely when such a trend might begin. There is no guarantee that any market forecast set forth in this presentation will be realized. (a) Market revenue per available foot (M-RevPAF) is a measure of the health of a market (or sector) that combines two key operating metrics (effective market rents and occupancy) into a single value.
Comparing real estate to equities and credit
The case for private real estate looks particularly compelling when compared with other asset allocations.
First, equity markets (both listed and private) are at historically high valuations and are, we believe, unlikely to provide the double-digit returns they have averaged over what’s now been more than a decade-long supercycle.
The equity market’s winners are also increasingly concentrated on the potential for artificial intelligence capital investment and returns. We believe investors should consider allocations away from such concentrated risk at such elevated valuations.
EXHIBIT 7
Valuations are cheap versus other risk assets
Commercial real estate, equities and high yield valuation percentiles(a)
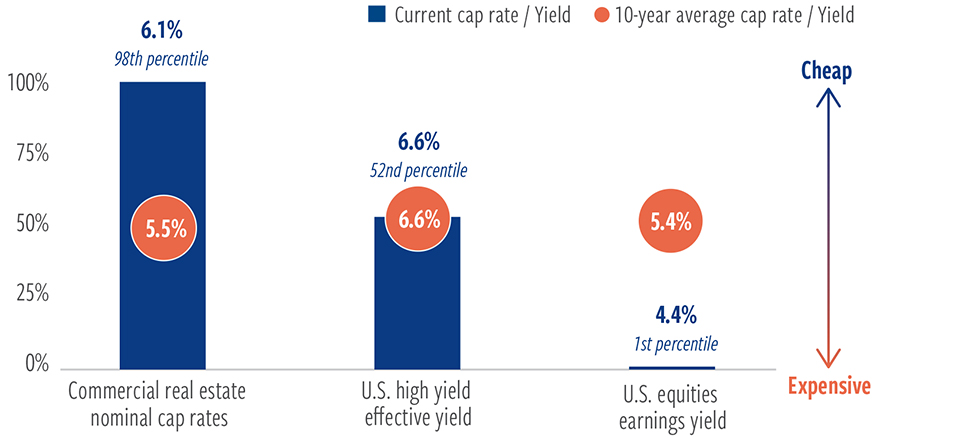
At October 31, 2025. Source: Bloomberg, Green Street, Cohen & Steers.
Data quoted represents past performance, which is no guarantee of future results. There is no guarantee that any historical trend illustrated above will be repeated in the future, and there is no way to predict precisely when such a trend will begin. The information presented above does not reflect the performance of any fund or other account managed or serviced by Cohen & Steers, and there is no guarantee that investors will experience the type of performance reflected above. (a) Commercial real estate nominal cap rates are represented by Green Street’s nominal cap rates, which are the expected unleveraged first-year yield a property buyer expects to realize on their investment. Like bond yields, nominal cap rates move inversely with property values. U.S. high yield effective yield is represented by the ICE BofA U.S. High Yield Index, which tracks the performance of U.S. dollar-denominated below-investment-grade rated corporate debt publicly issued in the U.S. domestic market. U.S. equities earnings yield is represented by the S&P 500 Index, which measures the performance of approximately 500 of the largest publicly traded companies in the United States.
Meanwhile, there are several reasons to believe private markets will struggle to repeat their extraordinary returns and (likely mischaracterized) low volatility of the past decade.
As mentioned earlier, the opportunity for private assets to lever investments at ultra-low and stable interest rates has largely vanished. At the same time, flows into private equity and private credit have surged, which we believe will challenge future returns.
Private credit’s explosive growth to $2 trillion AUM—ten times its 2009 size— has intensified competition among lenders. More lenders chasing borrowers creates concerns about lower underwriting standards. This concentration of capital pursuing the same deals suggests private credit returns may gradually converge toward traditional corporate bond market levels, challenging the sector’s “all-weather” reputation despite its attractive yield component.
In private equity, exits (as measured by transaction value, according to S&P Global) have fallen by nearly half their total since 2021, the last full year before rate hikes hit. The result is a backlog of investments that ties up capital, extends holding periods, and increases valuation risk, ultimately diluting potential returns for investors.
By comparison, real estate, which has already repriced for the next phase of the cycle, appears increasingly attractive. One notable measure: Real estate is now the only sector of the S&P 500 trading below its five-year average earnings multiple.
Considering that REITs provide a real-time indicator of value opportunity currently available in real estate, we believe this portends well for private real estate returns as well.
EXHIBIT 8
Real estate is the only GICS sector trading below 5-year average earnings
GICS sector current earnings multiples vs. 5-year average(a)
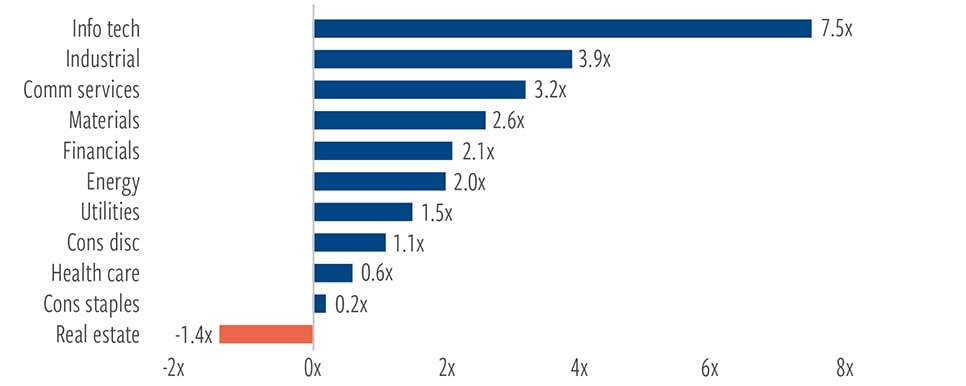
At October 31, 2025. Source: Bloomberg, Cohen & Steers.
Data quoted represents past performance, which is no guarantee of future results. There is no guarantee that any historical trend illustrated above will be repeated in the future, and there is no way to predict precisely when such a trend will begin. The information presented above does not reflect the performance of any fund or other account managed or serviced by Cohen & Steers, and there is no guarantee that investors will experience the type of performance reflected above. (a) Represented by the S&P 500 Index, which measures the performance of approximately 500 of the largest publicly traded companies in the United States.
The long-term case for private real estate
The reset in prices, supply/demand dynamics, and the relatively favorable profile of commercial real estate (compared with alternative allocations) are compelling. And that creates an unusual opportunity to access the longterm benefits of private real estate, in our view.
Understandably, perhaps, commercial real estate has been out of favor. According to the 2025 Real Estate Allocations Monitor, institutional investors reduced their target allocations to real estate for the first time in four years, albeit by just 10 basis points. But those same investors are below their target allocations by 90 basis points.
By comparison, individual investors often completely overlook real estate—the third-largest asset class in the world, behind stocks and bonds—when diversifying their portfolios beyond the traditional 60/40 mix.
Institutional investors, which have access to extensive research and professional analysts (and often decades of experience), as well as access to more vehicles and the ability to invest in private real estate, allocate 3.5 times as much of their capital to real estate than individual investors, on average.
We believe private real estate, especially when combined with listed real estate allocations, can and should help investors diversify, create more resilient portfolios, and improve Sharpe ratios given more attractive valuations and greater inflation sensitivity. Private real estate, in particular, presents investors with the opportunity for high tax-efficient yields, compared with other asset classes.
EXHIBIT 9
Reliable source of income with potential tax advantages
Average 10-year distribution rates(a)
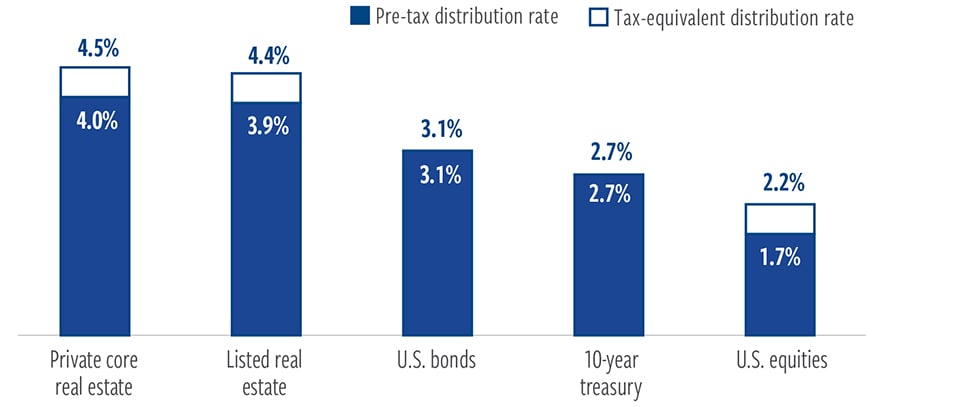
At December 31, 2025. Source: Cohen & Steers, Morningstar.
Data quoted represents past performance, which is no guarantee of future results. Private core real estate: NCREIF Fund Index –Open End Diversified Core Equity (NFI-ODCE); Listed real estate: FTSE Nareit All Equity REITs Index; U.S. equities: S&P 500 Index; U.S. bonds: Barclays U.S. Aggregate Bond Index; 10-year treasury: Barclays U.S. Treasury 5-7 Yr Index. (a) Average distribution rate calculated on a quarterly frequency for the trailing 10-year period ending December 31, 2022. After-tax calculation assumes taxation at the highest marginal tax rate for each security income type. Assumes all real estate securities yield is eligible for the 20% Qualified Business Income deduction. Does not include the Medicare surcharge
of 3.8% nor state and local taxes.
Real estate also has historically had low correlations to traditional asset classes, which matters at a time when investors are seeking more diversification, and given that stock and bond valuations are historically high.
Finally, too often, high-net-worth investors believe owning property covers their real estate allocations, but directly investing in real estate comes at a cost of illiquidity, high transaction expense (up to 5% during buying and selling), time-consuming management of a property (or the costs of employing a property manager), and large upfront costs.
Investing in a private real estate fund offers diversification, tax benefits, greater liquidity than direct investing, low-cost entry, and potential regularincome and returns over time. The bottoming of private real estate prices gives investors a compelling entry point to potentially benefit from those attributes.
The reset in prices creates an unusual opportunity to access the long-term benefits of private real estate, in our view
ABOUT THE AUTHORS

James Corl, Executive Vice President, is Head of the Private Real Estate Group.
Important Information
An investor cannot invest directly in an index, and index performance does not reflect the deduction of any fees, expenses or taxes. Index comparisons have limitations, as volatility and other characteristics may differ from a particular investment.
Data quoted represents past performance, which is no guarantee of future results. The views and opinions presented in this document are as of the date of publication and are subject to change. There is no guarantee that any market forecast set forth in this document will be realized. This material represents an assessment of the market environment at a specific point in time and should not be relied upon as investment advice, does not constitute a recommendation to buy or sell a security or other investment, and is not intended to predict or depict performance of any investment. This material is not being provided in a fiduciary capacity and is not intended to recommend any investment policy or investment strategy or to account for the specific objectives or circumstances of any investor. We consider the information to be accurate, but we do not represent that it is complete or should be relied upon as the sole source of appropriateness for investment. Cohen & Steers does not provide investment, tax or legal advice. Please consult with your investment, tax or legal professional regarding your individual circumstances prior to investing.
Risks of investing in private real estate. Private real estate investments are illiquid and susceptible to economic slowdowns or recessions and industry cycles, which could lead to financial losses and a decrease in revenues, net income and assets. Lack of liquidity in the private real estate market makes valuing underlying assets difficult. Appraisal values may vary substantially from a price at which an investment in real estate may actually be sold.
Risks of investing in real estate securities. The risks of investing in real estate securities are similar to those associated with direct investments in real estate, including falling property values due to increasing vacancies; declining rents resulting from economic, legal, political or technological developments; lack of liquidity; lack of availability of financing; limited diversification; sensitivity to certain economic factors, such as interest rate changes and market recessions; and changes in supply of or demand for similar properties in a given market. No representation or warranty is made as to the efficacy of any particular strategy or fund or the actual returns that may be achieved.
Cohen & Steers Capital Management, Inc. (Cohen & Steers) is a U.S. registered investment advisory firm that provides investment management services to corporate retirement, public and union retirement plans, U.S. endowments, foundations and mutual funds. Cohen & Steers Asia Limited is authorized and regulated by the Securities and Futures Commission of Hong Kong (ALZ367). Cohen & Steers Japan Limited is a registered financial instruments operator (investment advisory and agency business and discretionary investment management business with the Financial Services Agency of Japan and the Kanto Local Finance Bureau No. 3157) and is a member of the Japan Investment Advisers Association. Cohen & Steers Ireland Limited is regulated by the Central Bank of Ireland (No.C188319). Cohen & Steers UK Limited is authorized and regulated by the Financial Conduct Authority (FRN458459). Cohen & Steers Singapore Private Limited is a private company limited by shares in the Republic of Singapore.
For investors in the Middle East: This document is for informational purposes only. It does not constitute or form part of any marketing initiative, any offer to issue or sell, or any solicitation of any offer to subscribe or purchase any products, strategies or other services, nor shall it or the fact of its distribution form the basis of, or be relied on in connection with, any contract resulting therefrom. In the event that the recipient of this document wishes to receive further information with regard to any products, strategies or other services, it shall specifically request the same in writing from us.
All investing involves risk. Loss of principal is possible.