
Allocating to listed real assets may help investors better manage inflation risks—while also enhancing diversification potential and risk-adjusted returns.
- Traditional asset allocations may be unprepared for inflation
Stocks and bonds have historically delivered their strongest returns in periods of low inflation, and they may be in a precarious position if elevated inflation rates persist. - Real assets have historically provided key strategic allocation benefits
Real estate, infrastructure, commodities and resource equities have historically demonstrated (to varying degrees) attractive inflation dynamics, diversifying behaviors and strong full-cycle returns. - Investors’ approach to real assets depends on their objectives
A diversified allocation to real assets, adjusted according to the desired balance of tradeoffs, may offer an improved risk/reward profile with an attractive level of inflation sensitivity.
Traditional asset allocations may be unprepared for inflation
Everyone seems to have an opinion about inflation these days. Take what you hear with a grain of salt.
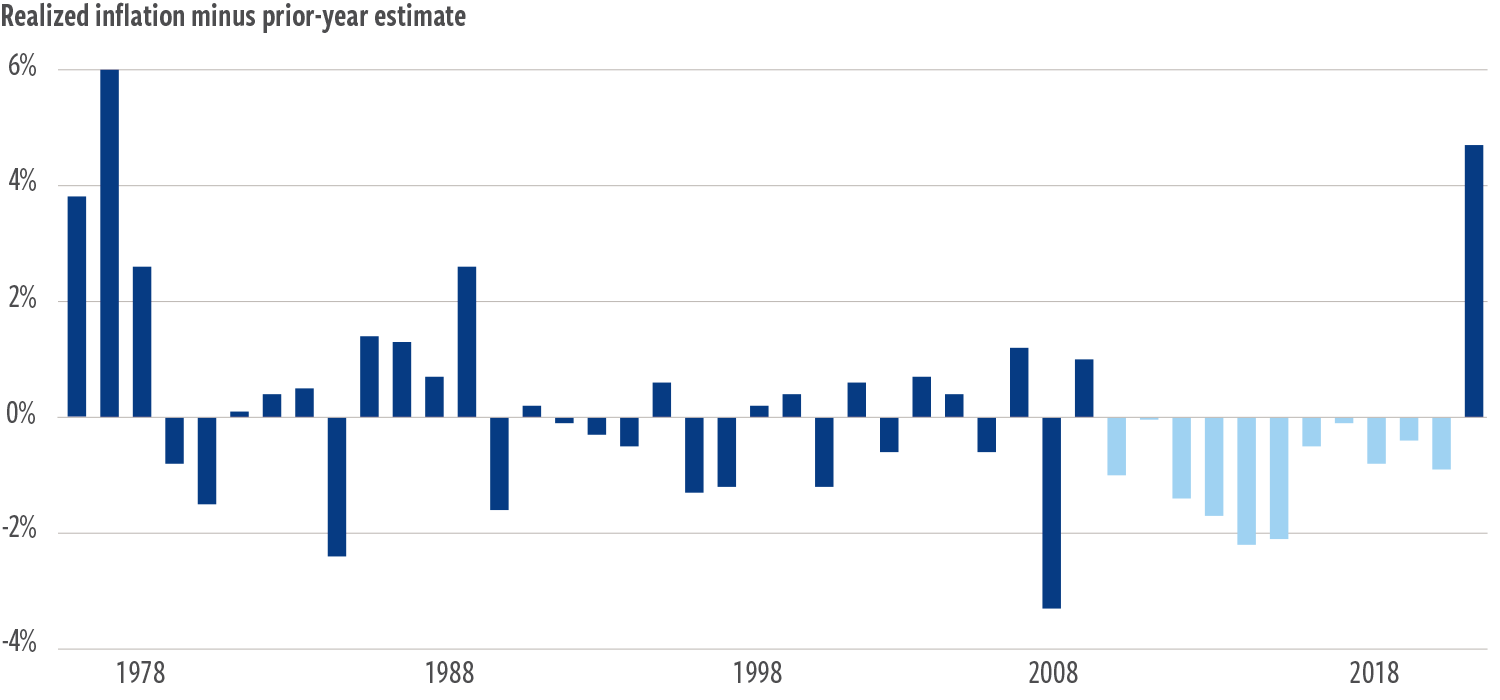
Since reliable surveys of U.S. consumer inflation expectations were initiated in the late 1970s, outlooks for the year ahead have missed the mark by more than 100 basis points nearly half the time. And until recently, estimates had been too low or too high with roughly equal frequency. The past decade, however, saw an unprecedented stretch of lower-than-expected inflation, while 2021 saw the largest inflation surprise in 40 years, as deflationary forces reversed and were augmented by new drivers of inflation (Exhibit 1).
While it may be true that “nobody knows nothin’” when it comes to forecasting inflation, the mere threat of a sustained higher inflation regime is inspiring many investors to reconsider the potential implications for their asset allocations—as they should.
EXHIBIT 1
Unexpected inflation hit a 40-year high in 2021
At December 31, 2021. Source: Bloomberg, U.S. Bureau of Labor Statistics, Cohen & Steers analysis.
Past performance is no guarantee of future results. Inflation measured by the year-over-year change in the U.S. Consumer Price Index (CPI) for all urban consumers. Inflation estimate based on the 1-year-ahead expected inflation, as measured by the University of Michigan survey of 1-year-ahead inflation expectations, the longest-running high-frequency series on inflation expectations, starting in 1978. When analysis does not involve expected inflation, we use our full database of asset class returns extending to 1973. The information presented above does not reflect the performance of any fund or other account managed or serviced by Cohen & Steers, and there is no guarantee that investors will experience the type of performance reflected above. See end notes for index associations, definitions and additional disclosures.
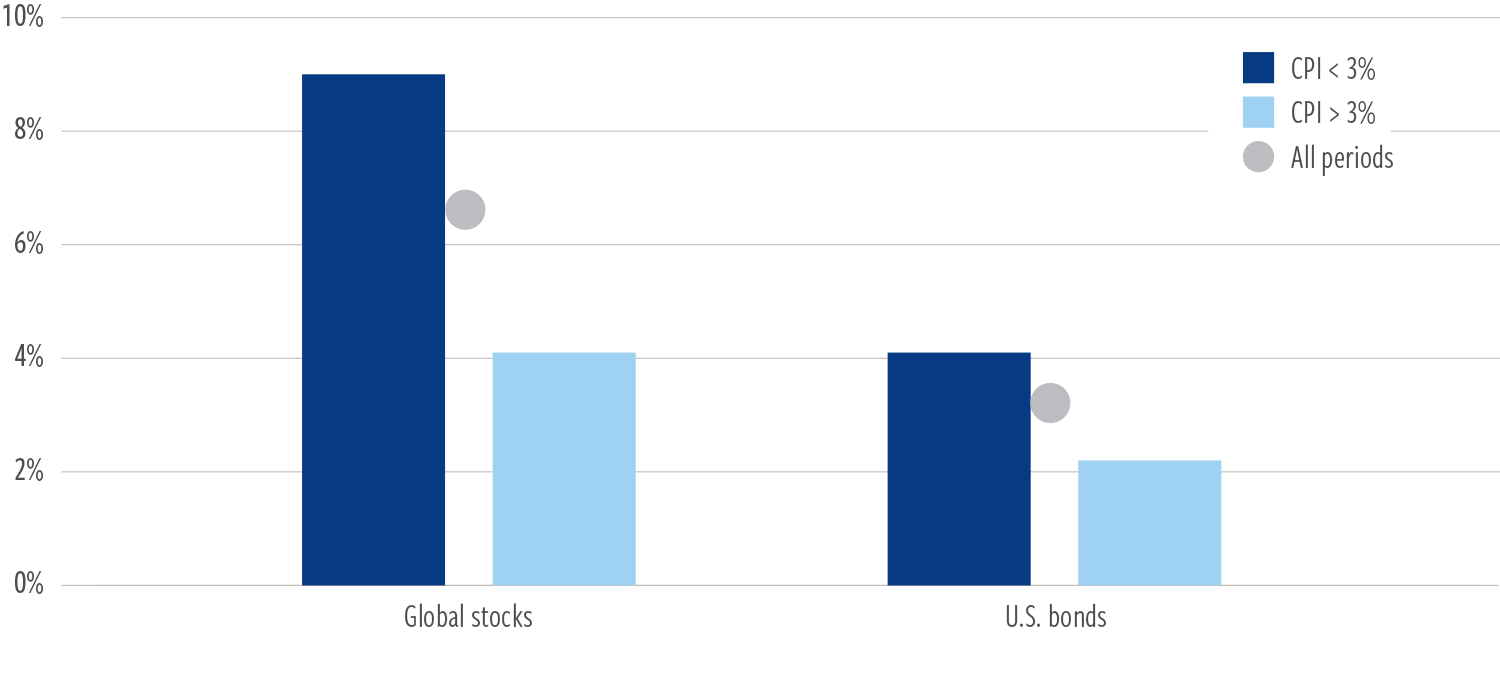
EXHIBIT 2
Stocks and bonds have performed best in low-inflation periods
Average annual real return, 1973–2021
At December 31, 2021. Source: Bloomberg, U.S. Bureau of Labor Statistics, Cohen & Steers analysis.
Past performance is no guarantee of future results. Inflation measured by the year-over-year change in the U.S. Consumer Price Index (CPI) for all urban consumers. The information presented above does not reflect the performance of any fund or other account managed or serviced by Cohen & Steers, and there is no guarantee that investors will experience the type of performance reflected above. See end notes for index associations, definitions and additional disclosures.
Median U.S. CPI inflation has been about 3% over the past 50 years—meaning half the years were above 3% and half were below. On average, real (inflation- adjusted) returns for stocks and bonds have skewed heavily in favor of periods of below-median inflation (Exhibit 2), implying that traditional asset allocations have likely benefited disproportionately from the prevalence of low inflation in recent years. And today, with real interest rates in deeply negative territory and equity valuations rivaled only by those seen during the tech bubble of the early 2000s, we believe most stock/bond allocations offer little margin of safety to defend against a prolonged, adverse inflation environment.
Turning to real assets
The need for inflation protection and diversification has taken on added significance amid a potential turning point in long-term economic trends, driven by historic fiscal spending on a global scale and central banks conditioned to let bouts of high inflation persist longer than under prior frameworks. Add to this mix tight labor markets that are driving wage inflation higher and a turn toward more disciplined capital management in natural resource industries that appears likely to drive a new bullish commodities cycle. For many institutional investors, this has led to a greater focus on real assets.
This growing category—once limited primarily to real estate and precious metals—now represents a sizeable allocation in many institutional portfolios, spanning infrastructure, commodities and natural resources, held privately and through listed markets. In contrast with inflation hedges such as CPI swaps, the appeal of real assets is rooted in their potential to help defend against inflation while also offering prospects for attractive long-term returns.
In this report, we examine the role of listed real assets in helping investors build portfolios that may offer 1) enhanced risk-adjusted return potential and 2) resiliency in a variety of economic and market environments.
Real assets have historically provided key strategic allocation benefits
Allocations to real assets have traditionally sought to achieve three primary objectives:
- Deliver outperformance in inflationary periods
- Enhance risk-adjusted returns via differentiated market sensitivities
- Maintain strong returns over full market cycles
Inflation sensitivity
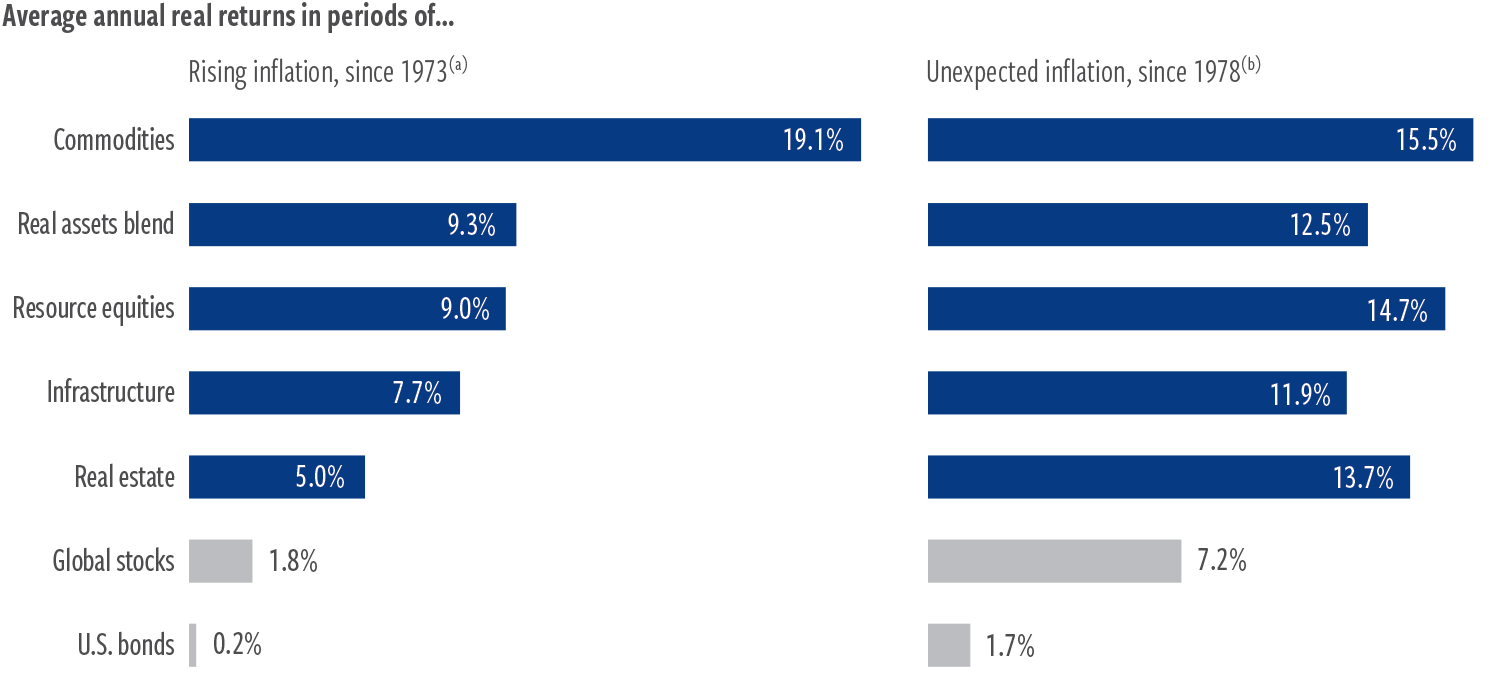
The one factor common to all real assets is their positive sensitivity to inflation surprises. The reason for this is simple: inflation often affects both asset prices and revenues of real assets, either directly through contractual inflation linkages or indirectly through fundamental economic drivers. This ability of real assets to counter inflation offers potential benefits to portfolios in the short term, as prices climb, and in the longer term, should inflation rates continue to surprise to the upside.
The result of these inflation relationships has historically been strong returns in environments of rising and unexpected inflation, whether looking at individual real assets categories or a diversified real assets blend (Exhibit 3).
EXHIBIT 3
Real assets have historically outperformed in inflationary environments
At December 31, 2021. Source: Barclays, Bloomberg, Dow Jones, FTSE, S&P, Refinitiv Datastream, Cohen & Steers.
Past performance is no guarantee of future results. (a) Represents common period of available asset class returns. Rising inflation measured as a positive difference between the year-over-year realized inflation rate and the lagged 1-year inflation rate. (b) Unexpected inflation data begins in 1978. Inflation measured by the year-over-year change in the Consumer Price Index for all urban consumers, published by the U.S. Bureau of Labor Statistics. Unexpected inflation measured as a positive difference between the year-over-year realized inflation rate and lagged 1-year-ahead expected inflation, as measured by the University of Michigan survey of 1-year-ahead inflation expectations. The diversified blend of real assets shown above is composed of 27.5% real estate, 27.5% commodities, 15% natural resource equities, 15% infrastructure, 10% short-duration fixed income and 5% gold. The real assets blend is not representative of an actual portfolio and is for illustrative purposes only. The information presented above does not reflect the performance of any fund or other account managed or serviced by Cohen & Steers, and there is no guarantee that investors will experience the type of performance reflected above. See end notes for index associations, definitions and additional disclosures.
How real assets are tied to inflation
Real estate
- Property replacement values tend to rise with the overall price environment due to rising costs of labor, land and materials.
- Real estate companies typically have high operating margins and low labor costs.
- Some commercial leases have explicit rent escalators tied to inflation.
- Sectors with shorter lease durations can take advantage of reflationary rents relatively quickly.
Commodities
- Commodities, such as grains, livestock and precious metals, frequently serve as direct inputs to inflation measures.
- Commodity prices tend to respond to economic forces—such as supply constraints and changes in global demand—that often drive the prices of other goods.
Infrastructure
- Cash flows and asset values may have direct or indirect links to inflation.
- For example, with regulated utilities, inflation is typically factored in when determining consumer rates and included in utility project costs that can affect a utility’s rate base.
- With toll roads and airports, local government agreements allow service rate increases based on fixed amounts above the inflation rate.
Resource equities
- Demand for essential resources (energy, food, metals) tends to be independent of rising or falling prices, typically allowing resource producers to pass through higher costs of labor, commodities and other inputs onto customers.
- As a result, prices for raw materials tend to rise with broader inflationary pressures, which may help increase cash flows and widen profit margins for producing companies.
Diversification potential
The goal of portfolio diversification is to own asset classes that tend to experience their above- and below-average returns in different economic and market environments—when one asset zigs, the expectation is that another will zag. This desynchronization of payoffs creates opportunities to build portfolios designed to perform well in a variety of scenarios. Real assets’ distinct economic sensitivities tend to differentiate them from stocks and bonds, most notably in relation to inflation and growth regimes.
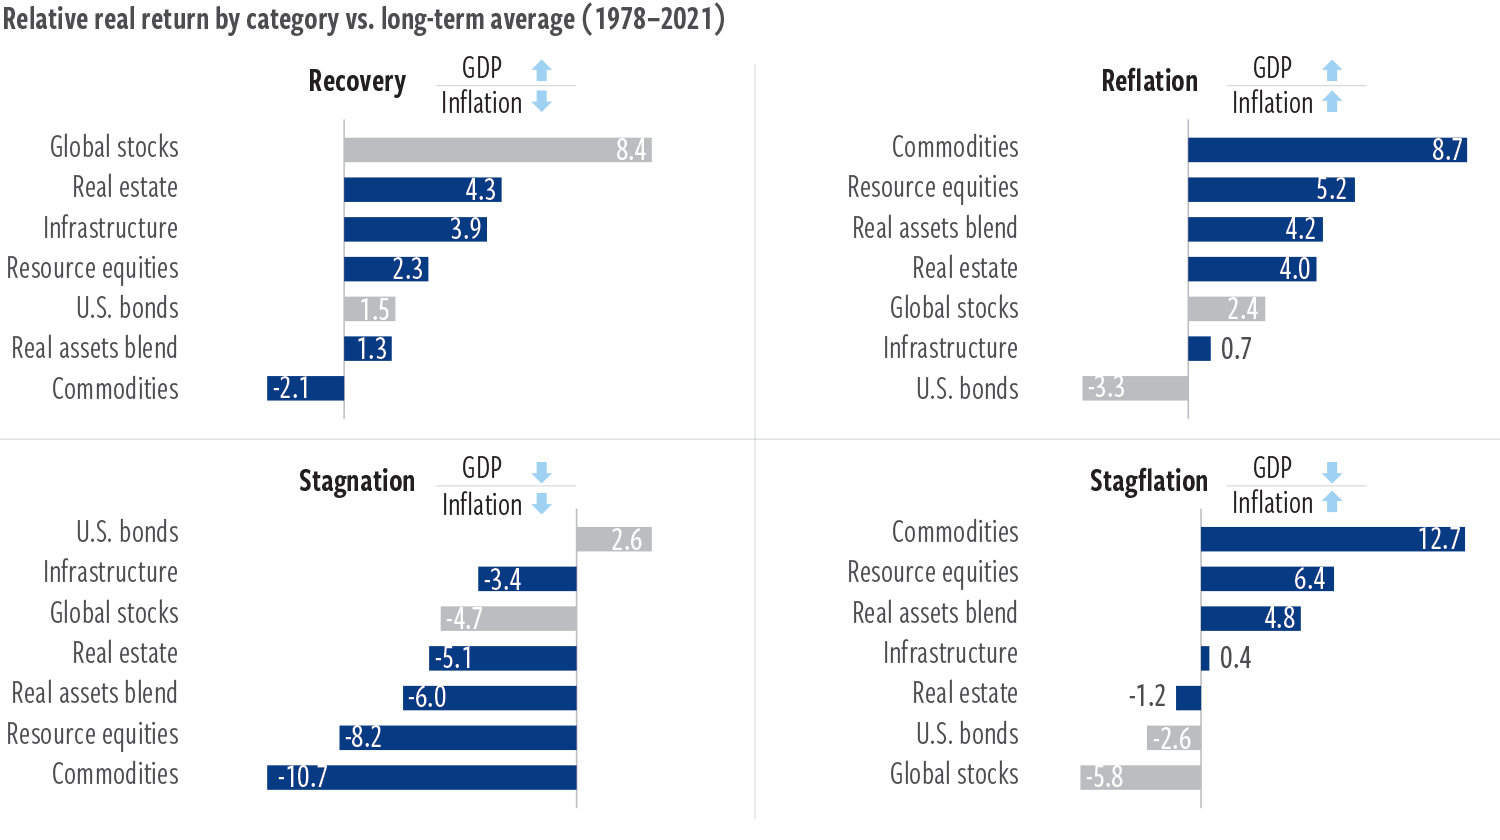
Exhibit 4 shows the historical inflation-adjusted performance of asset classes, relative to their long-term average, grouped by positive and negative surprises in economic growth and inflation. This analysis yields several observations:
- Real assets have typically performed well in reflationary conditions (unsurprisingly), as well as in stagflation—historically a challenging environment for both stocks and bonds.
- Commodities and resource equities are generally the most sensitive to upside inflation surprises, regardless of the growth backdrop.
- Real estate has been somewhat less geared to inflation trends and more tied to economic growth than commodity-linked real assets.
- Infrastructure has been fairly consistent across all regimes, including greater resilience in stagnation than other equity categories.
- A diversified real assets blend has delivered above-average returns in three of the four economic scenarios shown.
These differentiated responses to growth and inflation surprises demonstrate the potential of real assets to enhance portfolio stability over full economic cycles, potentially helping to offset periods that may be more difficult for generating attractive returns through stocks and bonds.
EXHIBIT 4
Differentiated behavior across growth and inflation regimes
At December 31, 2021. Source: Cohen & Steers proprietary analysis, Survey of Professional Forecasters, University of Michigan Survey of Consumers.
Past performance is no guarantee of future results. Returns represent annualized average, categorized according to whether U.S. gross domestic product and the U.S. Consumer Price Index were above or below their prior-year estimates, based on the Philadelphia Federal Reserve Survey of Professional Forecasters 4-quarter-ahead real GDP forecast and the University of Michigan survey of 1-year-ahead inflation expectations, respectively. Percent of periods represented in each regime: Recovery: 24%, Reflation: 25%, Stagflation: 16%, Stagnation: 35%. The information presented above does not reflect the performance of any fund or other account managed or serviced by Cohen & Steers, and there is no guarantee that investors will experience the type of performance reflected above. See end notes for index associations, definitions and additional disclosures.
Strong total returns
Real assets have historically generated strong returns over full market cycles, with all but commodities delivering performance in line with or better than global stocks over the past 50 years (Exhibit 5). The long-term average for commodities has been depressed by a decade-long bear market from 2008 to 2018, driven by the downshift in China demand and an oversupply cycle. However, commodities have since experienced substantial improvements in supply/demand fundamentals and a more supportive macroeconomic backdrop, providing potential catalysts for a sustained multi-year recovery.
The results below also demonstrate the potential benefits of combining multiple real assets within a single portfolio. A diversified real assets blend has historically delivered competitive returns with significantly less volatility than global stocks or standalone real assets, capitalizing on diversification benefits available within and among the different real assets categories.
EXHIBIT 5
Combining real assets may improve risk-adjusted returns
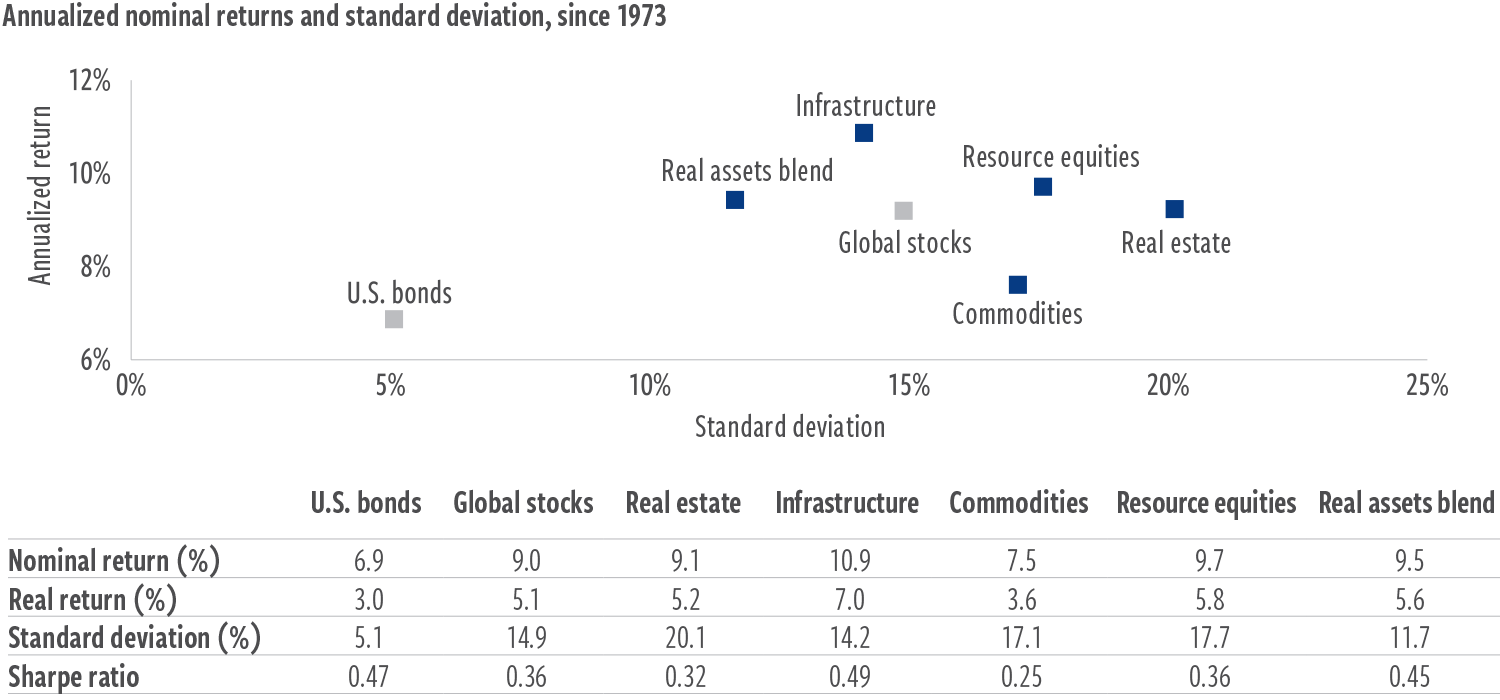
At December 31, 2021. Source: Barclays, Bloomberg, Dow Jones, FTSE, S&P, Refinitiv Datastream, Cohen & Steers.
Past performance is no guarantee of future results. Return reflects compound annualized return. Risk reflects annualized standard deviation of monthly returns. Standard deviation, also known as historical volatility, is a measure of the dispersion of a set of data from its mean and used by investors as a gauge for the amount of expected volatility. Sharpe ratio is a measure of risk-adjusted return, calculated by subtracting the risk-free rate from a return and dividing that result by the standard deviation. The higher the Sharpe ratio, the higher the risk-adjusted return. The information presented above does not reflect the performance of any fund or other account managed or serviced by Cohen & Steers, and there is no guarantee that investors will experience the type of performance reflected above. See end notes for index associations, definitions and additional disclosures.
Investors’ approach to real assets depends on their objectives
Historically, no single real asset has excelled across each of the criteria of inflation sensitivity, diversification potential and total returns. Some real assets have historically performed better on certain dimensions than others, requiring investors to consider various strengths and tradeoffs according to the specific role of real assets in their portfolio. Below are common considerations investors may evaluate when determining desired exposures.
Real estate
- Strong total return potential
- Balance of capital appreciation and income
- Potential for enhanced risk- adjusted returns
- Higher sensitivity to real rates and credit markets
Commodities
- Significant historical outperformance in periods of accelerating economic growth and higher inflation
- Low correlation to global stocks, indicating meaningful diversification potential
- Higher sensitivity to energy prices and U.S. dollar
Infrastructure
- Equity-like total return potential
- History of reduced volatility and greater resilience in down markets vs. global stocks
- Inflation-linked revenues in certain subsectors
- Access to secular opportunities in renewable energy and digital infrastructure
Resource equities
- Strong total return potential
- High inflation sensitivity
- Performance typically moves ahead of economic cycles
- Lead/lag with commodities
Our approach to designing multi-strategy portfolios
Although every investor’s needs are different, Cohen & Steers offers multi-strategy solutions that we believe provide an attractive balance of characteristics for most investors.
A central consideration in our portfolio construction is the inverse relationship often found between risk-adjusted returns and “inflation beta,” a measure of the sensitivity of asset returns to unexpected inflation. (For example, real estate’s historical inflation beta of 2.5 indicates typical outperformance of 2.5% for every 1% that inflation exceeded the prior-year estimate.)
As shown in Exhibit 6, industries and asset classes with higher inflation beta have generally produced a lower Sharpe ratio over the long term, indicated by the downward-sloping regression line.
EXHIBIT 6
Inflation beta has typically come at a cost to risk-adjusted returns
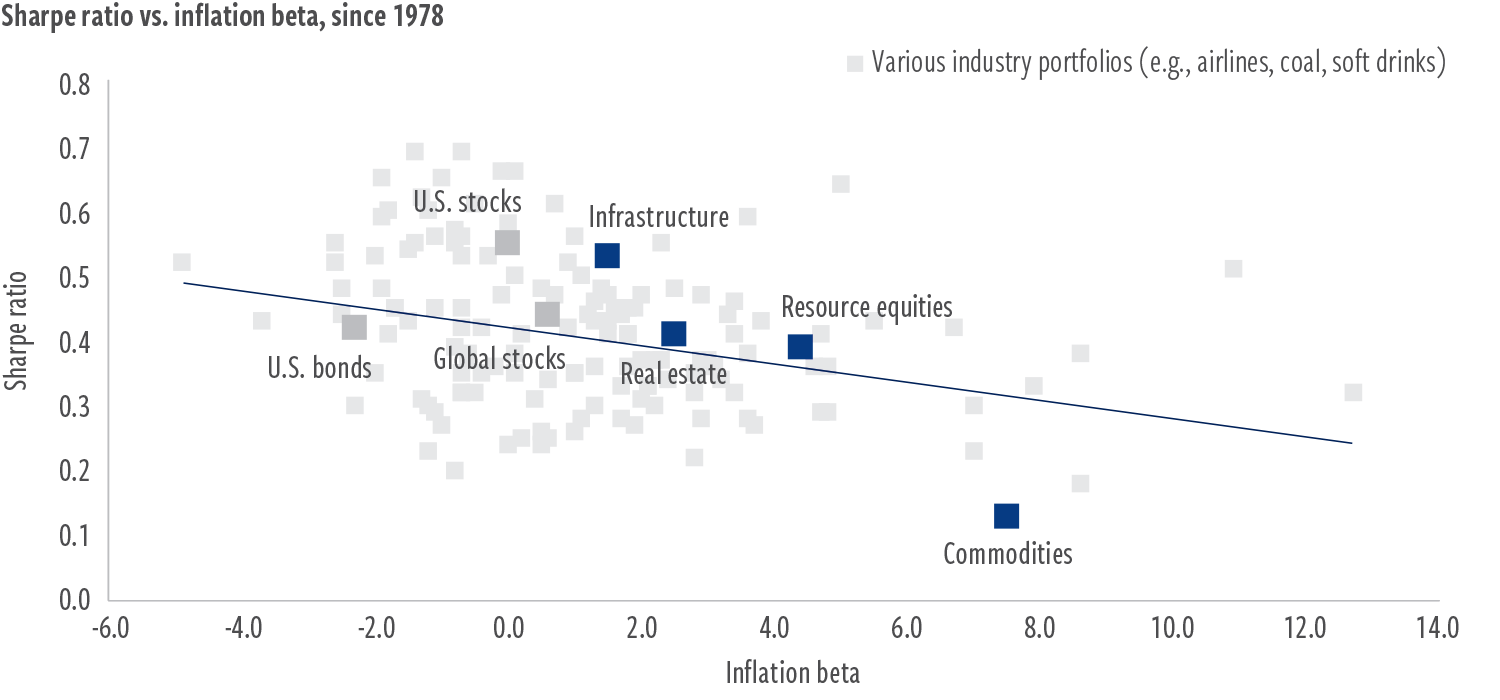
At December 31, 2021. Source: Barclays, Bloomberg, Dow Jones, FTSE, S&P, Refinitiv Datastream, Cohen & Steers proprietary analysis.
Past performance is no guarantee of future results. Sharpe ratio is a measure of risk-adjusted return, calculated by subtracting the risk-free rate from a return and dividing that result by the standard deviation. The higher the Sharpe ratio, the higher the risk-adjusted return. Standard deviation, also known as historical volatility, is a measure of the dispersion of a set of data from its mean and is used by investors as a gauge for the amount of expected volatility. Inflation beta is the sensitivity of returns to unexpected inflation. Inflation beta was determined by calculating the multivariate regression beta of 1-year real returns to the difference between the year-over-year realized inflation rate and lagged 1-year-ahead expected inflation, including the level of the lagged expected inflation rate. Expected inflation as measured reflects median inflation expectation from University of Michigan Survey of 1-year-ahead inflation expectations. Realized inflation is measured using the Consumer Price Index (CPI) for all urban consumers, published by the U.S. Department of Labor’s Bureau of Labor Statistics. The information presented above does not reflect the performance of any fund or other account managed or serviced by Cohen & Steers, and there is no guarantee that investors will experience the type of performance reflected above. See end notes for index associations, definitions and additional disclosures.
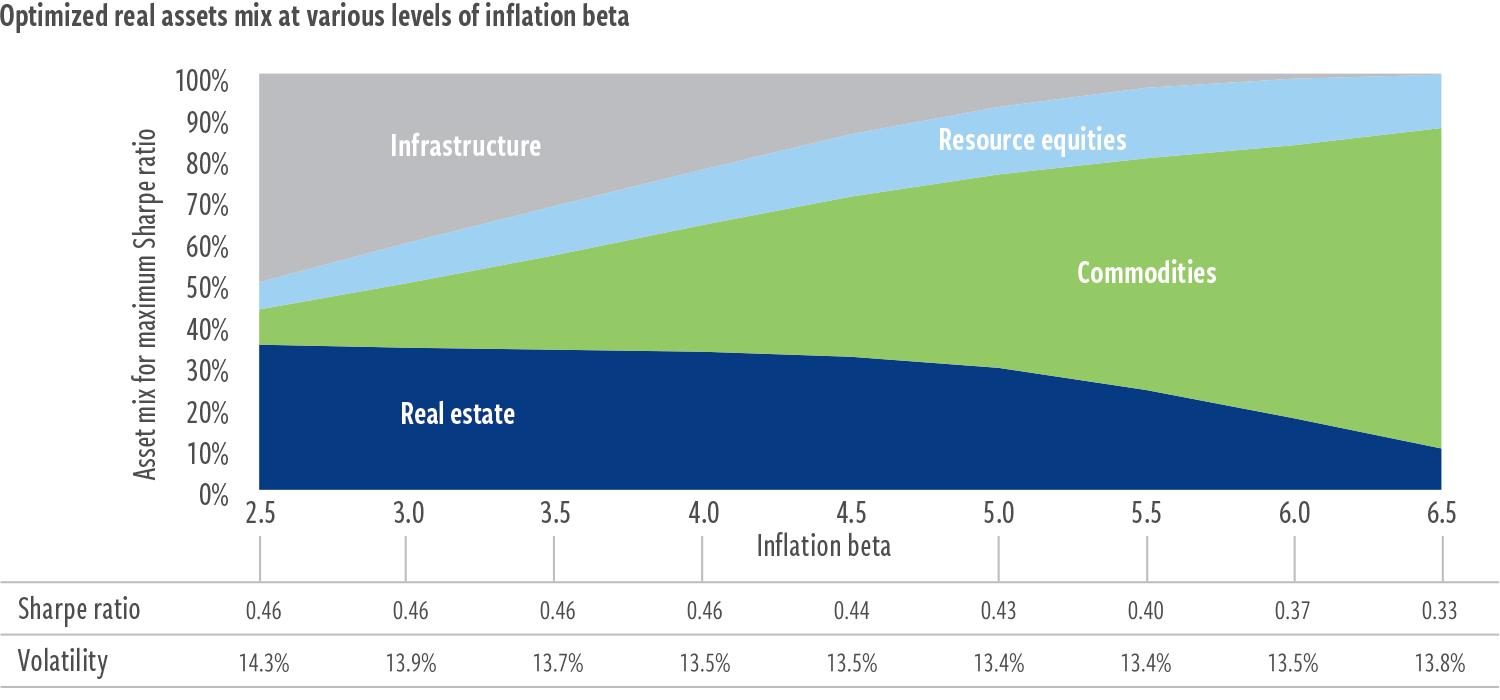
However, by exploiting the diversifying correlations among listed real assets, we believe investors can potentially mitigate much of this cost by targeting an allocation mix that seeks to maximize expected risk-adjusted returns at a given level of inflation beta.
Exhibit 7 illustrates the idea, displaying the central tendency of results from Monte Carlo simulations that begin with historical real assets correlations and volatilities but introduce expected returns as unknown, random variables (bound within a range determined by historical relationships with global equities and Cohen & Steers’ capital markets assumptions). The asset mix at each level of inflation beta represents the combination most likely to deliver the highest Sharpe ratio according to our Monte Carlo analysis.
EXHIBIT 7
Case study in real assets optimization
Investors may favor different types of real assets depending on the desired
inflation sensitivity
At December 31, 2021. Source: Barclays, Bloomberg, Dow Jones, FTSE, S&P, Refinitiv Datastream, Cohen & Steers proprietary analysis.
Results of this analysis may vary. The information generated by the simulation is illustrative in nature and does not reflect actual investment results and is not a guarantee of future results. Sharpe ratio maximizing portfolios based on Cohen & Steers simulations of all underlying real-asset asset classes shown above, using historical returns data from 1978–2021 and Cohen & Steers capital markets assumptions. Inflation beta is the sensitivity of returns to unexpected inflation. Inflation beta was determined by calculating the multivariate regression beta of 1-year real returns to the difference between the year-over-year realized inflation rate and lagged 1-year-ahead expected inflation, including the level of the lagged expected inflation rate. Expected inflation as measured reflects median inflation expectation from University of Michigan survey of 1-year-ahead inflation expectations. Realized inflation is measured using the Consumer Price Index (CPI) for all urban consumers, published by the U.S. Department of Labor’s Bureau of Labor Statistics. The information presented above does not reflect the performance of any fund or other account managed or serviced by Cohen & Steers, and there is no guarantee that investors will experience the type of performance reflected above. See end notes for index associations, definitions and additional disclosures.
From this analysis, we can draw several conclusions:
- Investors seeking any amount of inflation sensitivity will likely want to consider an allocation to commodities. Due to their low correlation with other real assets, commodities have also historically reduced overall portfolio volatility.
- Real estate is likely to be a meaningful component in any dedicated real assets allocation due to its attractive balance of expected risk-adjusted return potential and inflation sensitivity.
- Infrastructure and resource equities potentially offer additional attractive diversification benefits, with resource equities favored by investors seeking greater inflation sensitivity.
- Adequate diversification across real assets may enable access to higher levels of inflation sensitivity, with little impact on expected risk-adjusted returns—as well as meaningful volatility reduction—versus less diversified or standalone approaches.
Our analysis to this point has focused primarily on the tradeoffs among the real assets categories across the key dimensions of inflation sensitivity, diversification potential and expected returns. However, investors may need to account for other market sensitivities, depending on their allocation objectives.
In our own portfolios, for example, we generally seek exposure to additional diversifiers (e.g., smaller allocations to gold, short-duration credit and inflation- linked bonds) to help further reduce portfolio risk over time. As always, investor considerations will vary, but most important is the understanding that thoughtful diversification across real assets is likely to deliver improved risk/ reward outcomes, however risk and reward are defined.
Conclusion: Strategic inflation defense at attractive relative value
As investors consider how to best protect against the risk of higher inflation, history shows that including real assets in a portfolio may provide key benefits, including the potential for:
- Inflation sensitivity when needed
- Attractive risk-adjusted returns over full market cycles
- Added benefits from diversified real assets exposures
Moreover, the repeated and unprecedented disinflation surprises of the 2010s weighed on real assets returns while the broader market surged to ever- higher levels. This has resulted in historically attractive real assets valuations relative to equities, even after the group’s strong returns in 2021 (Exhibit 8).
We believe this combination of potential inflation benefits, diversification and relative value represents a compelling opportunity to realign portfolios to take advantage of what real assets can offer.
EXHIBIT 8
Real assets are trading near 20-year lows relative to stocks
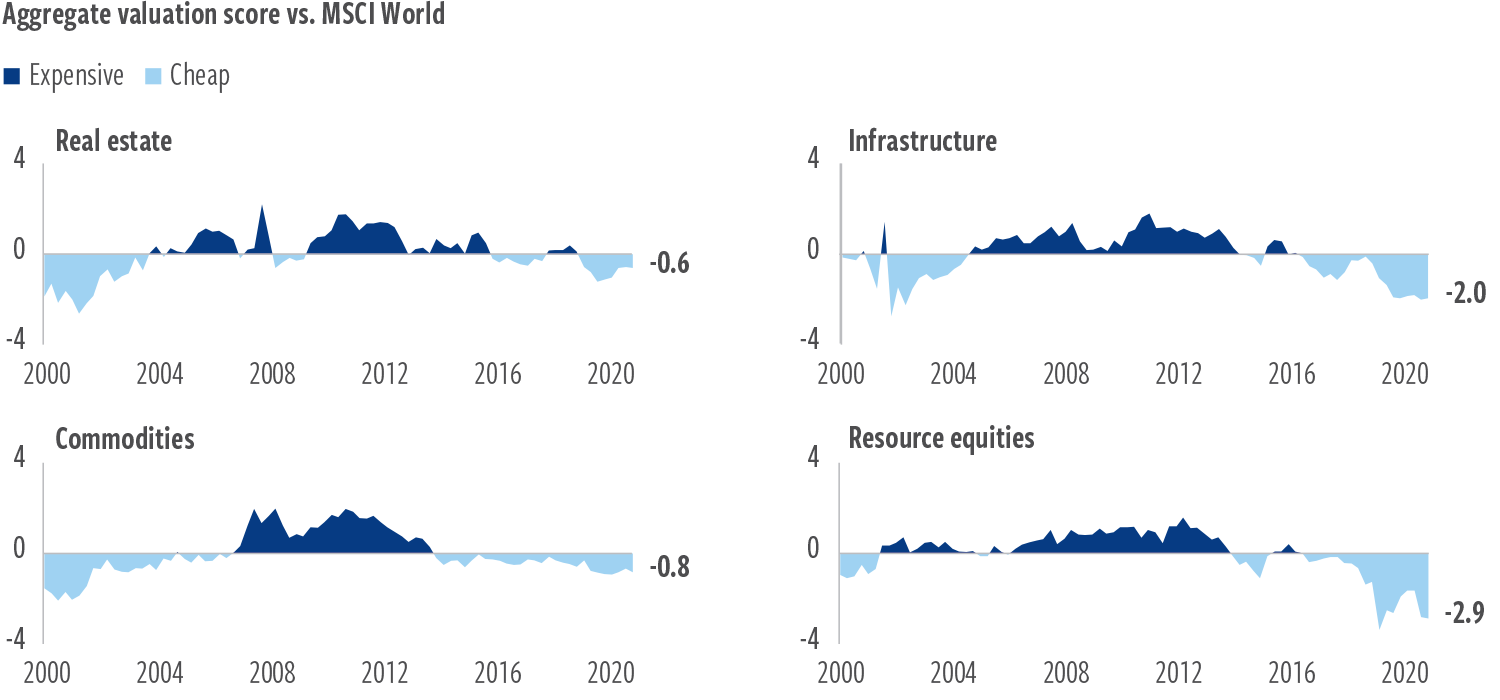
At December 31, 2021. Source: Bloomberg, S&P Xpressfeed, Cohen & Steers proprietary analysis.
Past performance is no guarantee of future results. Valuation scores represent composites of various metrics: global equities/infrastructure/ resource equities: cashflow-to-price, dividend yield and book-to-price; real estate: FFO-to-price, dividend yield and book-to-price; commodities: weighted real spot price. Real estate, infrastructure and resource equities based on proprietary Cohen & Steers data for respective stock universes, constructed from the S&P Global Xpressfeed database. Global equities represented by Datasteam World Index. Commodities represented by Bloomberg Commodity Index. The information presented above does not reflect the performance of any fund or other account managed or serviced by Cohen & Steers, and there is no guarantee investors will experience the type of performance reflected above. There is no guarantee that any historical trend illustrated above will be repeated in the future, and there is no way to predict precisely when such a trend might begin. See end notes for index definitions and additional disclosures.
ABOUT THE AUTHORS

Vince Childers, CFA, Senior Vice President, is Head of Real Assets Multi-Strategy and a portfolio manager for Cohen & Steers’ real assets strategy.
Index definitions / important disclosures
An investor cannot invest directly in an index and index performance does not reflect the deduction of any fees, expenses or taxes. Index comparisons have limitations as volatility and other characteristics may differ from a particular investment.
Real assets blend: 27.5% real estate, 27.5% commodities, 15% infrastructure, 15% resource equities, 10% short-duration fixed income and 5% gold. Real estate: Datastream Developed Real Estate Index through 12/31/89; FTSE EPRA Nareit Developed Index thereafter. The Datastream Developed Real Estate Index represents real estate companies from developed markets and is compiled by Refinitiv Datastream. The FTSE EPRA Nareit Developed Index is an unmanaged market-weighted total return index which consists of many companies from developed markets that derive more than half of their revenue from property-related activities. Commodities: The Bloomberg Commodity Total Return Index is a broadly diversified index that tracks the commodity markets through exchange-traded futures on physical commodities, which are weighted to account for economic significance and market liquidity. Infrastructure: 50/30/20 blend of Datastream World Gas, Water & Multi-Utilities, Datastream World Pipelines and Datastream World Railroads through 12/31/02; Dow Jones Brookfield Global Infrastructure Index thereafter. The Datastream World Index Series encompasses global indexes of companies in their respective sectors (World Gas, Water & Multi-Utilities; Materials; Oil & Gas; and Pipelines) and is compiled by Refinitiv Datastream. The Dow Jones Brookfield Global Infrastructure Index is a float-adjusted market-capitalization-weighted index that measures performance of globally domiciled companies that derive more than 70% of their cash flows from infrastructure lines of business. Resource equities: 50/50 Blend of Datastream World Oil & Gas and Datastream World Basic Materials through 12/31/02; S&P Global Natural Resources Index thereafter. The S&P Global Natural Resources Index includes 90 of the largest publicly traded companies in natural resources and commodities businesses that meet specific investability requirements, offering investors diversified, liquid and investable equity exposure across three primary commodity-related sectors: Agribusiness, Energy and Metals & Mining. Short-duration fixed income: ICE BofA U.S. Corporate & Government Index through 12/31/75; ICE BofA 1–3 Year U.S. Corporate Index thereafter. The ICE BofA U.S. Corporate & Government Index represents USD-denominated investment-grade debt publicly issued in the U.S. domestic market, including U.S. Treasury,
U.S. agency, foreign government, supranational and corporate securities. The ICE BofA 1–3 Year U.S. Corporate Index tracks the performance of USD-denominated investment-grade corporate debt publicly issued in the U.S. domestic market with a remaining term to maturity of less than 3 years. Gold: Gold spot price in USD per Troy ounce. Global stocks: MSCI World Index, a market-capitalization-weighted index consisting of a wide selection of stocks traded in 24 developed markets. U.S. stocks: S&P 500 Index, an unmanaged index of 500 publicly traded large-capitalization U.S. stocks representing a variety of industries. U.S. bonds: Bloomberg U.S. Aggregate Bond Index, a broad-based index that measures the investment-grade USD-denominated fixed-rate taxable bond market.
This presentation is provided to qualified institutional and professional investors or their advisors only for informational purposes and reflects prevailing conditions and our judgment as of this date, which are subject to change. It does not constitute investment advice or a recommendation or offer. We consider the information in this presentation to be accurate, but we do not represent that it is complete or should be relied upon as the sole source of appropriateness for investment. Past results are not necessarily indicative of future results. There is no guarantee that any historical trend illustrated above will be repeated in the future, and there is no way to predict precisely when such a trend will begin. The views and opinions are as of the date of publication and are subject to change without notice. Risks involved with investment, including potential loss of capital, should be carefully considered. Diversification does not ensure a profit or protect against loss.
The mention of specific commodities is not a recommendation or solicitation to buy, sell or hold any commodity interests. Strategies that trade in commodities involve a risk of loss.
No representation or warranty is made as to the efficacy of any strategy or fund or the actual returns that may be achieved.
Cohen & Steers Capital Management, Inc. (Cohen & Steers) is a registered investment advisory firm that provides investment management services to corporate retirement, public and union retirement plans, endowments, foundations and mutual funds. Cohen & Steers UK Limited is authorized and regulated by the Financial Conduct Authority (FRN458459). Cohen & Steers Japan Limited is a registered financial instruments operator (investment advisory and agency business and discretionary investment management business with the Financial Services Agency of Japan and the Kanto Local Finance Bureau No. 3157) and is a member of the Japan Investment Advisers Association. Cohen & Steers Asia Limited is authorized and regulated by the Securities and Futures Commission of Hong Kong (ALZ367). Cohen & Steers Ireland Limited is regulated by the Central Bank of Ireland (No.C188319).
For readers in the Middle East: This document is for informational purposes only. It does not constitute or form part of any marketing initiative, any offer to issue or sell, or any solicitation of any offer to subscribe or purchase, any products, strategies or other services, nor shall it or the fact of its distribution form the basis of, or be relied on in connection with, any contract resulting therefrom. In the event the recipient of this document wishes to receive further information about any products, strategies or other services, it shall specifically request the same in writing from us.