
Adding listed REIT allocations to U.S. private real estate portfolios can lead to higher returns, reduced risk and lower drawdowns over a full cycle.
KEY TAKEAWAYS
- Listed and private: Converging paths on diverging timelines
Private real estate, which typically lags listed REITs, appears to have bottomed. Today’s limited new supply, resilient income and discounted valuations offer favorable conditions for long-term investors in both listed and private. - Adding listed REITs to a private portfolio can improve outcomes
Listed REITs have similar long-term risk profiles to core private real estate. But their low short-term correlations means combination portfolios may improve returns, reduce volatility and lower drawdowns. - REITs are a great vehicle for core real estate investing
We believe institutional investors should consider a blend of private real estate and listed REITs for their core holdings, while using opportunistic/value-add private for satellite allocations.
Converging paths on diverging timelines
Many institutional investors around the world invest in U.S. commercial private real estate. It is, after all, the world’s largest commercial real estate (CRE) market, offering a wide array of investment opportunities. Foreign investors are motivated by a variety of factors, including the potential for high returns, diversification of their real estate portfolio, and the long-term stability and security of the U.S. political and economic environment.
The current real estate cycle is following a familiar script (Exhibit 1). After declining well ahead of private values, listed REITs have risen sharply from their October 2023 lows. Meanwhile, unlevered private real estate values have notched four consecutive quarters of modestly positive total returns after repricing by approximately 20% over the prior seven quarters. We anticipate modest to moderate gains over the next 12–18 months before accelerating more meaningfully. Since the ODCE Index’s 1978 introduction, once private values turn positive, the momentum typically continues, with the shortest run having lasted more than two years.
This return dispersion is not surprising given that listed REITs historically lead private in both downturns and recoveries. As listed securities, REITs reflect future events quickly. In contrast, private real estate values adjust much more slowly as declining transaction volumes can limit transparency, while appraisal valuations are inherently lagged.
EXHIBIT 1
Listed real estate leads private market values in downturns and recoveries
Cumulative total returns from 1Q 2020
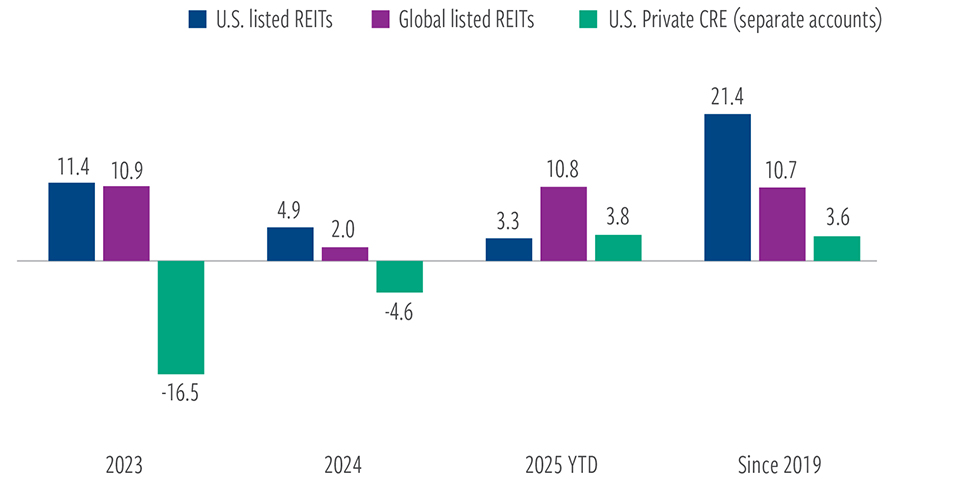
At November 30, 2025. Source: NCREIF, Bloomberg, Cohen & Steers.
Past performance is no guarantee of future results. The information presented above does not represent the performance of any fund or other account managed or serviced by Cohen & Steers, and there is no guarantee that investors will experience the type of performance listed above. U.S. listed real estate represented by the FTSE Nareit All Equity REITs Index. Private real estate represented by levered NCREIF Property Index gross total returns for properties held in separately managed accounts. Listed REIT returns are as of November 30, 2025. U.S. private returns are as of September 30, 2024, the latest available data. See endnotes for index definitions and additional disclosures
Some investors may consider the lower volatility of private investments a feature that smooths returns (compared with the “bug” of REITs’ real- time pricing and higher volatility). However, the dispersion in returns in recent years illustrate that the illiquidity has made it difficult for institutions to manage their real estate allocations and capital pacing. This can be especially true early in the cycle, when private investors may have difficulty putting cash to work—in contrast to REITs, which can be purchased in size daily on a stock exchange.
Adding listed REITs to private CRE portfolios can improve outcomes
This generational reset in commercial real estate prices is an opportunity for institutional investors to look more closely at their real estate allocations. We believe the market environment is setting up for strong vintage-year returns for 1) private real estate funds with fresh capital and 2) listed REITs that will be able to take advantage of their favorable access to capital and cheaper debt to net acquire assets for the first time in more than a decade.
Amid this shift, however, we recognize that old ways of thinking can be hard to change. Listed REITs typically take a backseat to private real estate in allocation decisions, despite REITs’ long history of generating returns that are similar to or better than private real estate (Exhibit 2). While private returns over certain longer-term time frames appear more attractive, note that they are reported gross of fees. Note, too, that private separately managed accounts generally use greater leverage than listed REITs. Indeed, when we compare total returns net of fees of the NCREIF ODCE Index, a composite index of 38 capitalization- weighted U.S. open-end commingled private real estate funds pursuing a core U.S. investment strategy, to total returns of listed REITs, listed REITs produce superior returns over longer-term time horizons.
EXHIBIT 2
U.S. REIT returns historically comparable to U.S private real estate
Listed and private real estate annualized returns (%)
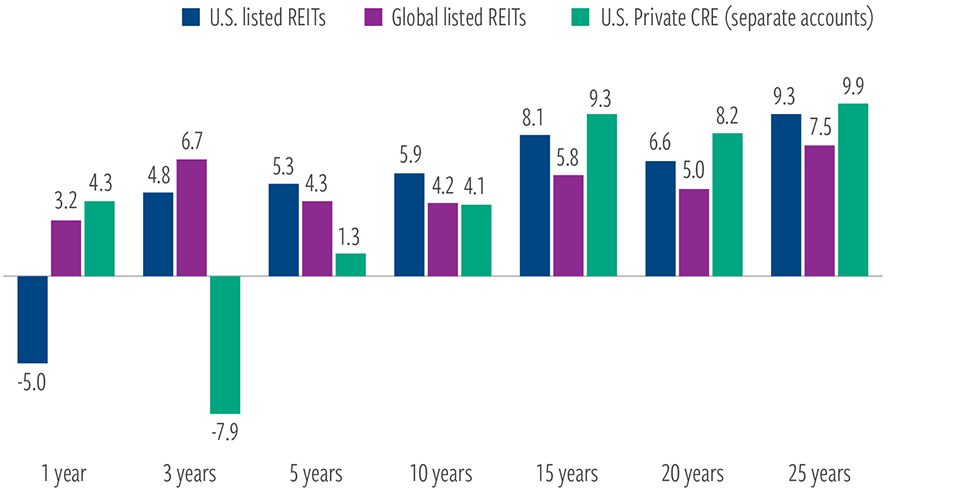
At November 30, 2025. Source: NCREIF, Morningstar Direct, Cohen & Steers.
Past performance is no guarantee of future results. The information presented above does not reflect the performance of any fund or account managed by Cohen & Steers, and there is no guarantee that investors will experience the type of performance reflected above. Listed real estate represented by the FTSE Nareit All Equity REITs Index. Private real estate represented by levered NCREIF Property Index gross total returns for properties held in separately managed accounts. See endnotes for index definitions and additional disclosures.
This mindset occurs despite REITs generally employing relatively low-risk core strategies focused on high-quality, stabilized properties with modest leverage. The reluctance is also notable given that listed REIT mandates can typically be invested/liquidated quickly, in contrast to private real estate, where transactions can take time and potential withdrawal limits exist with private real estate funds.
One oft-cited reason that investors favor private is that listed U.S. REITs can be highly correlated with equities in the short term and are, therefore, more volatile. However, over longer time frames, listed REIT returns (as with private real estate) are driven by the cash flows and growth profiles of the underlying property holdings.
As an example, while year-over-year returns of U.S. listed REITs are only 28% correlated with private real estate on an as-reported basis, those correlations jump to around 77% when private real estate returns are lagged just two to three quarters. We believe similar relationships hold true to various degrees when looking at other regions.
Potential benefits of adding listed REITs to a private real estate portfolio
Given U.S. listed REITs’ strong long-term returns and diversifying characteristics, we believe there are compelling reasons to adding a 10–50% allocation to U.S. listed REITs. At certain levels, portfolios blending U.S. private with U.S. listed real estate allocations may increase Sharpe ratios, reduce volatility and mitigate drawdown risk (Exhibit 3).
EXHIBIT 3
Adding U.S. listed REITs to a U.S. private real estate portfolio may increase returns and mitigate drawdowns
Sensitivity analysis of static blends (2015 – 2025)
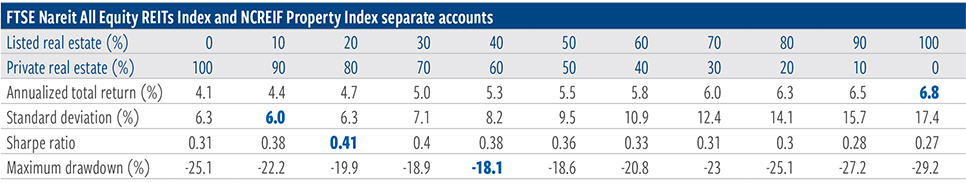
At September 30, 2025. Source: Bloomberg, NCREIF, Cohen & Steers.
Past performance is no guarantee of future results. The information presented above does not reflect the performance of any fund or other account managed or serviced by Cohen & Steers, and there is no guarantee that investors will experience the type of performance reflected above. Listed real estate represented by the FTSE Nareit All Equity REITs Index. Private real estate represented by levered NCREIF Property Index gross total returns for properties held in separately managed accounts. Standard deviation measures the volatility of an investment’s return over a given period. The Sharpe ratio is a measure of risk-adjusted return, calculated by subtracting the risk-free rate from a return and dividing the result by the standard deviation; a higher Sharpe ratio reflects better risk-adjusted performance. See endnotes for index definitions and additional disclosures.
Goal-based listed REIT allocations in diversified private real estate portfolios
| Objective | Allocation | Outcome |
|---|---|---|
| Mitigate volatility | 10% | By adding a hypothetical 10% static allocation of U.S. listed REITs to a diversified private real estate portfolio, the standard deviation of returns since 2015 decreased by 30 basis points, while annualized total returns also improved. |
| Maximize Sharpe ratio | 20% | Annualized total returns since 2015 increased 60 basis points (to 4.7%) by adding a 20% allocation to listed REITs, while volatility held steady, improving the Sharpe ratio. |
| Mitigate drawdown risk | 40% | Since 2015, adding a 40% REIT allocation resulted in a max drawdown of 18.1% vs 25.1% for a 100% private portfolio. |
| Maximize total return | 40‑50% | This allocation has generated greater than 5.3% annualized total returns since 2015, compared to 4.1% for a 100% portfolio of private real estate. And while the volatility increased and the Sharpe ratio declined, the maximum drawdown was meaningfully reduced. |
Adding a listed REIT allocation to a private real estate portfolio can help optimize your goals
Over the past 10 years, many international investors purchased U.S. industrial and multi-family residential assets (either directly, or indirectly via funds weighted towards those sectors). While those sectors have enjoyed favorable tailwinds in recent years, as Exhibit 4 shows, there was a compelling benefit of adding a 10–40% allocation to listed REITs even within private portfolios concentrated in industrial and multi-family.
EXHIBIT 4
Adding U.S. listed REITs to U.S. private industrial or multi-family portfolios may increase returns and mitigate drawdowns
Sensitivity analysis of static blends (2015 – 2025)
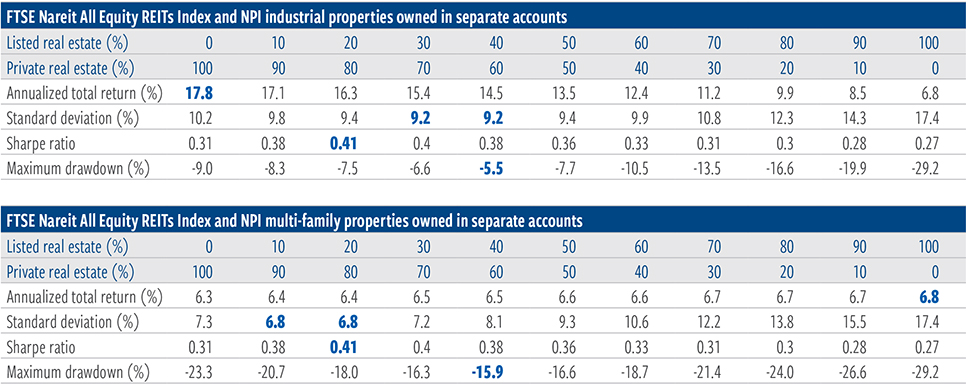
At September 30, 2025. Source: Bloomberg, NCREIF, Cohen & Steers.
Past performance is no guarantee of future results. The information presented above does not reflect the performance of any fund or other account managed or serviced by Cohen & Steers, and there is no guarantee that investors will experience the type of performance reflected above. Listed real estate represented by the FTSE Nareit All Equity REITs Index. Private real estate represented by levered NCREIF Property Index gross total returns for properties held in separately managed accounts. Standard deviation measures the volatility of an investment’s return over a given period. The Sharpe ratio is a measure of risk-adjusted return, calculated by subtracting the risk-free rate from a return and dividing the result by the standard deviation; a higher Sharpe ratio reflects better risk-adjusted performance. See endnotes for index definitions and additional disclosures.
Even private portfolios concentrated in recent years in the hot U.S. sectors of industrial and multi-family residential would have benefited from an allocation to listed REITs.
Global REITs offer similar benefits
The global listed REIT market has underperformed both U.S. listed REITs and U.S. private real estate over the last decade due to greater interest rate sensitivity in Europe and larger macro challenges in Asia (i.e., China), plus smaller weightings in sectors that have done well, such as data centers. Yet not withstanding this relative underperformance, a 10-year look back also shows a reduction in volatility, improved risk-adjusted results and lower maximum drawdowns by adding a global listed REITs allocation to U.S. private real estate (Exhibit 5).
An investor’s unique objectives dictate the ideal balance of listed REITs in a portfolio of private real estate. Above, we highlight a few key points based on simple examples of hypothetical portfolios with a range of listed and private real estate allocations.
This may all seem counterintuitive at first glance; however, keep in mind that, as previously shown, listed REITs and private real estate have low correlations over short time frames. One typically zigs when the other zags, which can be used to an investor’s benefit. For instance, in 2022, private real estate rose while listed REITs declined. In 2023, U.S. and global listed REITs rose by 10–11% and U.S. private real estate declined by more than 16%.
These are simplified examples, and these metrics could be improved even more through active management of listed REITs, but we believe it helps to illustrate that there is an illiquidity return discount in core private real estate (unlike other private assets that typically trade at premiums to their public peers) and that investors should embrace listed REITs as a diversification tool that can potentially meaningfully enhance results. This analysis holds true over longer time periods as well.
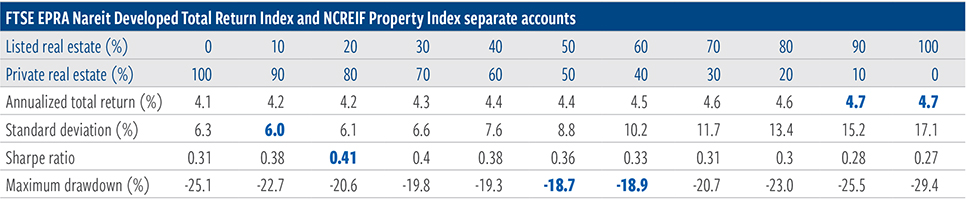
EXHIBIT 5
Adding global listed REITs can likewise improve U.S. private real estate portfolio outcomes
Sensitivity analysis of static blends (2015-2025)
At September 30, 2025. Source: Bloomberg, NCREIF, Cohen & Steers.
Past performance is no guarantee of future results. The information presented above does not reflect the performance of any fund or other account managed or serviced by Cohen & Steers, and there is no guarantee that investors will experience the type of performance reflected above. Global listed real estate represented by the FTSE EPRA Nareit Developed Total Return Index. Private real estate represented by levered NCREIF Property Index gross total returns for properties held in separately managed accounts. Standard deviation measures the volatility of an investment’s return over a given period. The Sharpe ratio is a measure of risk-adjusted return, calculated by subtracting the risk-free rate from a return and dividing the result by the standard deviation; a higher Sharpe ratio reflects better risk-adjusted performance. See endnotes for index definitions and additional disclosures.
Listed REITs are well suited for core real estate allocations
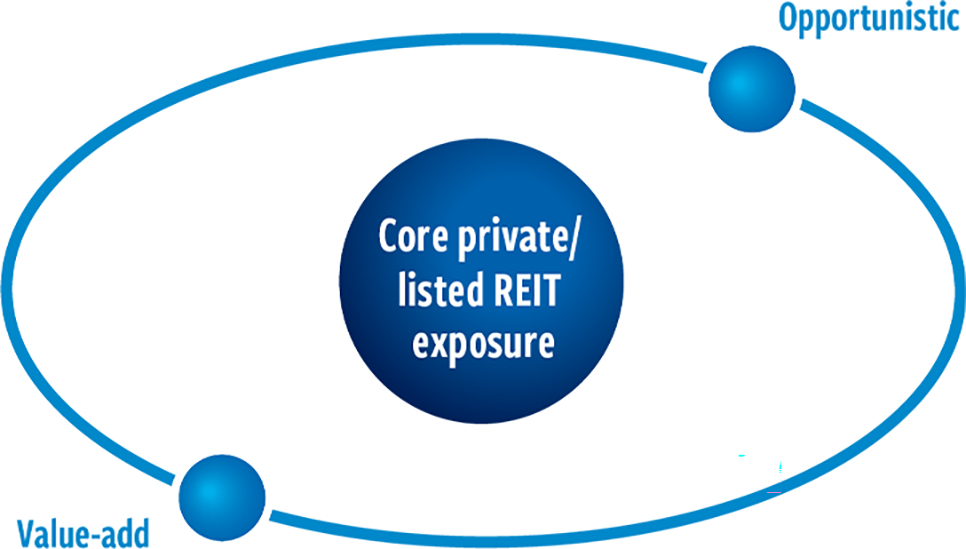
For core real estate allocations, institutional investors have traditionally favored private investments while relegating listed REITs to a satellite bucket. We believe institutional investors should instead consider a blend of private investments and actively managed listed REITs for their core holdings and use opportunistic/value-add private for satellite investments (Exhibit 6).
While core private real estate and listed REITs are different types of investment vehicles, the underlying property holdings are similar. Long-term appreciation and dividends for both are driven primarily by the cash flows and growth profiles of the underlying property holdings.
Listed REITs are particularly well suited for diversified, core stabilized real estate exposure given their access to a broader set of real estate sectors and competitive advantage afforded by their ability to opportunistically raise capital quickly and efficiently. Listed REITs are also highly liquid, and implementing allocations are generally inexpensive to make.
Meanwhile, private real estate investments can be used to further diversify a portfolio with strategies targeting higher risk and higher return potential. These could include development projects or distressed assets, in which investors may have control of the properties and, by extension, value add and opportunistic private fund investments.
EXHIBIT 6
Listed REITs offer high-quality exposure to core property types
Hypothetical core/satellite model centered on listed REITs
At September 30, 2025. Source: Cohen & Steers analysis.
Rolling return analysis shows consistency of REIT outperformance
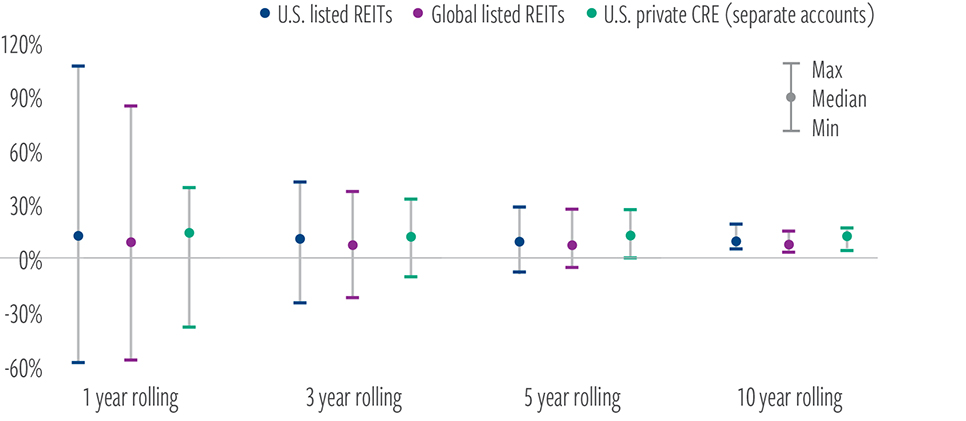
Private investors frequently cite REITs’ equity-like characteristics as reason to avoid listed real estate. It is true that short-term returns for listed and private real estate are uncorrelated (heavily influenced by the smoothed appraisal values of private relative to the daily pricing of REITs). However, the two asset classes’ dispersions of returns over longer rolling periods are similar (Exhibit 7).
We believe a longer-term comparison offers investors insight into the risk of meeting their objectives in a way that is more in line with their investment time horizons. Over 3-, 5- and 10-year rolling periods, the range of REIT returns narrows dramatically.
Active REIT managers have historically outperformed passive investments, as they can often develop a differentiated view of the direction of property cash flows and asset values, identifying securities with upside potential and possibly sidestepping sectors that may be facing long-term headwinds.
The median active U.S. REIT strategy generated a 10-year annualized return 36 basis points above its preferred REIT benchmark after fees, while top-quartile strategies delivered an average excess return of 89 basis points after fees (based on eVestment Alliance data as of September 30, 2025). The same holds true for global REITs, where the median active strategy generated a 10-year annualized return 88 basis points above its preferred REIT benchmark net of fees, while top-quartile strategies delivered an average excess return of 132 basis points after fees.
EXHIBIT 7
Rolling returns measure investment risk in a way that aligns with investors’ time horizons
Dispersion of annualized returns (%, quarterly rolling periods 2005 – 2025)
At September 30, 2025. Source: NCREIF, FTSE Nareit, Cohen & Steers.
Past performance is no guarantee of future results. The information presented above does not reflect the performance of any fund or other account managed or serviced by Cohen & Steers, and there is no guarantee that investors will experience the type of performance reflected above. U.S. REITs represented by the FTSE Nareit All Equity REITs Index. Global REITs represented by FTSE EPRA Nareit Developed Real Estate Index. Private real estate represented by levered NCREIF Property Index gross total returns for properties held in separately managed accounts. See endnotes for index definitions and additional disclosures.
Methodology
U.S. private commercial real estate is represented in this report by levered property returns for a subset of the NCREIF Property Index (NPI) that are owned in separately managed accounts (SMAs). An SMA is a fund structure between a fund manager and one investor, typically a large institution. It comprises a unique portfolio of direct real estate assets that are managed by the fund manager to match the specific investment objectives, policies and reporting requirements of the investor. They are often non-discretionary in terms of investment decisions.
Large non-U.S. institutional investors often prefer SMAs over pooled funds when investing in U.S. commercial real estate, which is why we have focused on SMAs in this report. Moreover, we think the asset mix and leverage of the index is broadly representative of how many international institutions are invested in U.S. private real estate.
In total, there are 1,815 properties included in the analysis as of 3Q25 (vs 1,132 as of 1Q10), with leverage of ~49% loan-to-value. By count, approximately 39% of these accounts were industrial and 29% multifamily, followed by office (15%) and retail (15%). Individual separate account strategies may be focused on a specific property type rather than having more diversified exposure, and while they can implement various strategies, we believe the assets owned in SMAs are primarily core/core-plus.
ABOUT THE AUTHORS

Jon Cheigh, President & Chief Investment Officer, leads the investment department.
Index definitions / important disclosures
An investor cannot invest directly in an index, and index performance does not reflect the deduction of any fees, expenses or taxes.
U.S. listed real estate: The FTSE Nareit All Equity REITs Index contains all tax-qualified REITs with more than 50% of total assets in qualifying real estate assets other than mortgages secured by real property that also meet minimum size and liquidity criteria. Global listed real estate: The FTSE EPRA Nareit Developed Index is a free-float adjusted market-capitalization-weighted index designed to track the performance of eligible listed real estate companies in developed markets. “FTSE®” is a trademark of the LSE Group and is used by FTSE International Limited (“FTSE”) under license. “NAREIT®” is a trademark of Nareit. All rights in the FTSE Nareit All Equity REITs Index and FTSE EPRA Nareit Developed Index (the “Indexes”) vest in FTSE and Nareit. Neither FTSE, nor the LSE Group, nor Nareit accept any liability for any errors or omissions in the indexes or data, and no party may rely on any indexes or data contained in this communication. No further distribution of data from FTSE or Nareit is permitted without the relevant organization’s express written consent. FTSE, the LSE Group, and Nareit do not promote, sponsor or endorse the content of this communication. Private real estate: The National Council of Real Estate Investment Fiduciaries (NCREIF) Property Index levered gross total returns for properties held in separately managed accounts. By count, approximately 39% of these accounts are industrial and 29% multifamily, followed by office (15%) and retail (15%).
Data quoted represents past performance, which is no guarantee of future results. There is no guarantee that any historical trend referenced herein will be repeated in the future, and there is no way to predict precisely when such a trend might begin. Index comparisons have limitations as volatility and other characteristics may differ from a particular investment. This material is for informational purposes and reflects prevailing conditions and our judgment as of this date, which are subject to change. There is no guarantee that any market forecast set forth in this presentation will be realized. This material represents an assessment of the market environment at a specific point in time and should not be relied upon as investment advice,
does not constitute a recommendation to buy or sell a security or other investment, and is not intended to predict or depict performance of any investment. This material is not being provided in a fiduciary capacity and is not intended to recommend any investment policy or investment strategy or to take into account the specific objectives or circumstances of any investor. We consider the information in this presentation to be accurate, but we do not represent that it is complete or should be relied upon as the sole source of appropriateness for investment. Please consult with your investment, tax or legal professional regarding your individual circumstances prior to investing.
Risks of investing
Real estate securities: Risks of investing in real estate securities are similar to those associated with direct investments in real estate, including falling property values due to increasing vacancies or declining rents resulting from economic, legal, political or technological developments, lack of liquidity, limited diversification and sensitivity to certain economic factors such as interest rate changes and market recessions. Foreign securities involve special risks, including currency fluctuations, lower liquidity, political and economic uncertainties, and differences in accounting standards. Some international securities may represent small- and medium-sized companies, which may be more susceptible to price volatility and may be less liquid than larger companies. No representation or warranty is made as to the efficacy of any particular strategy or fund or the actual returns that may be achieved. Private real estate: Private real estate has historically experienced significant fluctuations and cycles
in value. The marketability and value of direct real estate investments will depend on many factors, and the ultimate performance of private real estate investments will be subject to the varying degrees of risk generally incident to the ownership and management of real estate generally. For example, revenues and asset values may be adversely affected by changes in general or local economic conditions and/or securities markets, availability of credit, the quality of the management of each property, changing default and foreclosure rates, the financial condition of tenants, buyers and sellers of properties, competition from prospective buyers for, and sellers of, other similar properties, changes in interest rates and in the availability, cost and terms of financing, the impact of present or future environmental legislation and compliance with environmental laws, changes in tax rates and other operating expenses, adverse changes in governmental laws, regulations and fiscal policies, energy and supply shortages, changes in the relative popularity of properties as an investment, acts of God, acts of war, terrorism, epidemics and pandemics, vandalism or civil unrest, adverse changes in zoning laws, availability and costs of insurance, and other factors beyond the control of Cohen & Steers. No representation or warranty is made as to the efficacy of private real estate investing or the actual returns that may be achieved.
Cohen & Steers Capital Management, Inc. (Cohen & Steers) is a U.S. registered investment advisory firm that provides investment management services to corporate retirement, public and union retirement plans, endowments, foundations and mutual funds. Cohen & Steers Asia Limited is authorized and regulated by the Securities and Futures Commission of Hong Kong (ALZ367). Cohen & Steers Japan Limited is a registered financial instruments operator (investment advisory and agency business and discretionary investment management business with the Financial Services Agency of Japan and the Kanto Local Finance Bureau No. 3157) and is a member of the Japan Investment Advisers Association. Cohen & Steers UK Limited is authorized and regulated by the Financial Conduct Authority (FRN458459). Cohen & Steers Ireland Limited is regulated by the Central Bank of Ireland (No.C188319). Cohen & Steers Singapore Private Limited is a private company limited by shares in the Republic of Singapore. For recipients in the Middle East: This document is for informational purposes only. It does not constitute or form part of any marketing initiative or any offer to issue or sell (or any solicitation of any offer to subscribe or purchase) any products, strategies or other services, nor shall it or the fact of its distribution form the basis of, or be relied on in connection with, any contract resulting therefrom. In the event that the recipient of this document wishes to receive further information with regard to any products, strategies or other services, it shall specifically request the same in writing from us.