
How portfolio architecture, bottom-up security selection and dynamic asset allocation can unlock real assets opportunities.
KEY TAKEAWAYS
- Architecture is an active decision
With no universally accepted benchmark, deciding which real assets categories to include, and how to combine them, is the first active step toward achieving long-term objectives. - Security selection drives alpha
Wide dispersion in security returns and the unique complexities of each real assets category create alpha(1) opportunities for real assets specialists. - Top-down allocation can add value
Relative value opportunities across core real assets can justify disciplined shifts, provided they maintain the portfolio’s strategic purpose.
(1) Please refer to the Index Associations and Definitions page.
AI optimism and the HALO effect
Two powerful forces are shaping today’s stock and bond markets: the evolving AI revolution and an era of scarcity that’s fueling a bull market in the physical economy.
Growing supply/demand imbalances have driven real assets higher in recent years, giving rise to the acronym HALO: heavy assets, low obsolescence. Today’s surging demand for more physical assets, such as steel, copper and power generation for data centers, isn’t limited to the AI boom. A much broader set of megatrends—deglobalization and reshoring, aging demographics, global urbanization and accelerating energy demand—are also creating long-term opportunities across the real assets universe.
These secular themes are new, but the underlying need for real assets is not. Long before HALO captured headlines, investors relied on real assets—often concentrated in commodities or inflation-indexed bonds (TIPS)—for inflation protection. Each serves a purpose but has clear limits. Commodities offer high inflation sensitivity but with episodic returns. TIPS offer a more modest return potential yet can still lag during inflationary periods as interest rate-sensitive bonds.
What has changed is the breadth of the real assets opportunity set, given today’s era of scarcity. Categories such as real estate, natural resource equities and listed infrastructure, often overlooked in the past, have emerged as compelling sources of return, broadening the toolkit well beyond inflation protection alone. Today’s investor still needs inflation sensitivity but can now pursue it alongside a stronger return profile and genuine portfolio diversification.
Still, questions remain: What’s the best way to access these opportunities? And how should investors combine the four core real assets categories—real estate, commodities, natural resource equities and infrastructure—into a cohesive portfolio?
As real assets specialists, we sought to answer these questions in 2012 with the introduction of our active real assets architecture.
The core four real assets

Strategic architecture is an active decision
Unlike global equities, where the MSCI World Index provides a widely recognized benchmark, real assets have no universally accepted standard. Deciding how to combine the core real assets categories into a strategic benchmark is therefore an active decision in its own right.
Our framework begins with three key outcomes investors seek from real assets: positive inflation sensitivity, diversification and attractive long-term returns. Each outcome matters, but no individual real assets category delivers all three equally well.
Inflation sensitivity: Real assets can respond positively to inflation surprises through rising commodity prices, regulated or contracted revenues tied to inflation, and cash flows linked to essential physical assets. Because inflation shocks can challenge stocks and bonds simultaneously, maintaining a permanent allocation to real assets can bolster portfolio resilience.
Diversification: A well-designed blend can diversify traditional stock and bond risks, while also diversifying risk exposures within the real assets allocation itself. Individually, the core real assets respond differently to economic growth, inflation, interest rates, and long-term capital cycles. Finding the right blend requires a framework that balances these exposures to improve risk-adjusted performance.
Expected returns: A real assets allocation must earn its place in a portfolio by delivering attractive performance over full market cycles. Real estate, infrastructure and natural resource equities have historically offered equity-like growth and income, while commodities can capture scarcity premiums arising from supply/demand imbalances across energy, metals and agriculture.
To arrive at our strategic blend, we score each real assets category on its ability to deliver across the three objectives, using shaded circles to illustrate the results (Exhibit 1). No single category scores highest across all three.
EXHIBIT 1
No single category delivers every benefit equally well
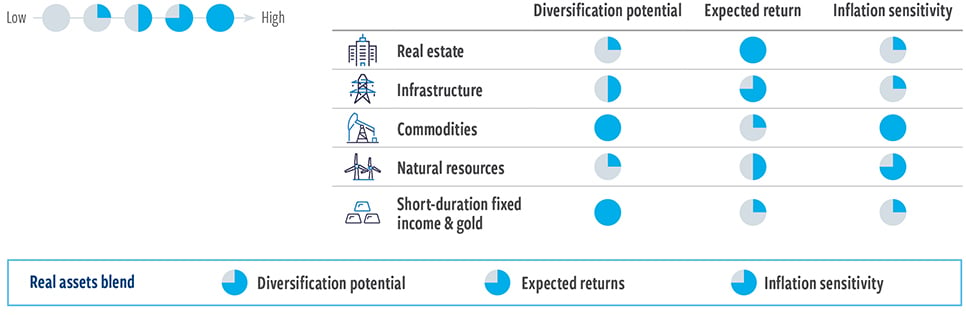
At June 30, 2026. Source: Cohen & Steers.
The mention of specific securities is not a recommendation or solicitation to buy or hold a particular security in a sector and should not be relied upon as investment advice. Strategies that trade in commodities involve a risk of loss. The qualitative criteria in the above chart represent relative strengths across the real asset categories discussed.
Commodities, for example, score highest on inflation sensitivity but make a more limited contribution to expected returns. Real estate exhibits the opposite profile, scoring highest on expected returns but contributing less to inflation sensitivity. Combining complementary categories can therefore produce a more balanced real assets portfolio.
Constructing the strategic real assets blend
By intentionally combining real assets categories with complementary characteristics, we seek to create a more balanced strategic benchmark. The foundation is an equally-weighted barbell of real estate and commodities, which has historically produced lower volatility than either category individually (Exhibit 2). Real estate contributes long-term growth potential through income-producing properties, while commodities respond to scarcity in physical resources such as energy and metals, particularly during inflation shocks. These contrasting return drivers diversify one another across multiple measures of risk, creating a more balanced starting point.
We then add smaller allocations to infrastructure and natural resource equities, further improving the benchmark’s historical Sharpe ratio, although with somewhat higher equity beta and lower inflation sensitivity. Finally, allocations to gold and short-duration bonds help reduce overall volatility and equity beta while further improving risk-adjusted performance.
EXHIBIT 2
Building our benchmark in deliberate stages
Optimized for risk-adjusted returns, inflation sensitivity and diversification
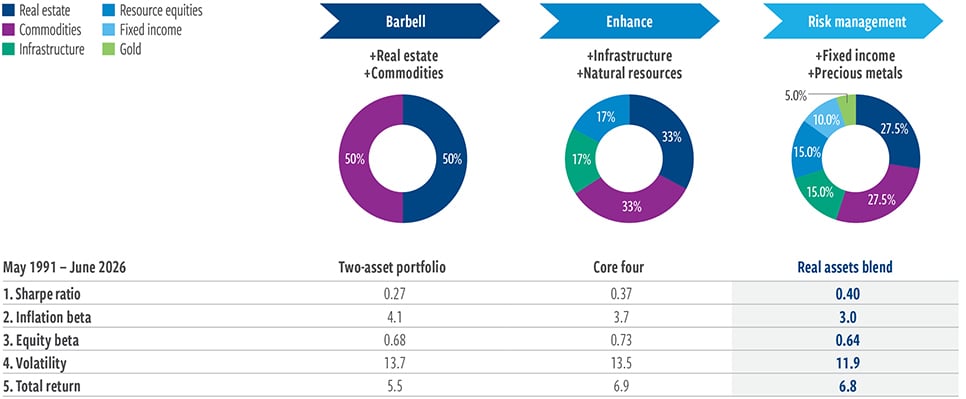
At June 30, 2026. Source: Barclays, Bloomberg, Dow Jones, FTSE, S&P, Refinitiv Datastream, Cohen & Steers.
Data quoted represents past performance, which is no guarantee of future results. There is no guarantee that any historical trend illustrated above will be repeated in the future, and there is no way to predict precisely when such a trend will begin. The information presented above does not reflect the performance of any fund or other account managed or serviced by Cohen & Steers, and there is no guarantee that investors will experience the type of performance reflected above. Please refer to the Index Associations and Definitions page for important information on the index proxies. Sharpe ratio is a measure of risk-adjusted return, calculated by subtracting the risk-free rate from a return and dividing that result by the standard deviation (volatility). The higher the Sharpe ratio, the higher the risk-adjusted return. Inflation beta is the sensitivity of returns to unexpected inflation. Inflation beta was determined by calculating the multivariate regression beta of 1-year real returns to the difference between the year-over-year realized inflation rate and lagged 1-year ahead expected inflation, including the level of the lagged expected inflation rate. Expected inflation as measured reflects median inflation expectation from University of Michigan Survey of 1-Year Ahead Inflation Expectations. Realized Inflation is measured using the Consumer Price Index (CPI) for all Urban Consumers, published by the United States Department of Labor’s Bureau of Labor Statistics. Equity beta measures a security’s sensitivity to broad stock market movements, indicating the degree to which its returns tend to rise or fall relative to the market. Volatility is represented by standard deviation, a measure for variation of price of a financial instrument over time.
By combining the core real assets in stages, the benchmark moderates the risks of individual real assets sleeves, each of which can periodically fall out of favor across full market cycles (Exhibit 3).
Consider commodities. Many investors find a standalone allocation difficult to maintain because returns can be episodic, with periods of prolonged underperformance a possibility. Combining commodities with real estate in the barbell anchor can make commodity investments more palatable. This helps investors preserve positive sensitivity to unexpected inflation shocks, which are inherently difficult to forecast.
To be clear, while lower volatility is not an end in itself, it can help investors remain committed to a strategic real assets allocation through changing market environments. Our active architecture is designed to complement traditional stock and bond portfolios across shifting economic cycles, during unexpected inflation shocks and throughout an investor’s time horizon.
EXHIBIT 3
Blending moderates the risks of individual real assets sleeves
Annualized nominal returns and standard deviation, May 1991–June 2026
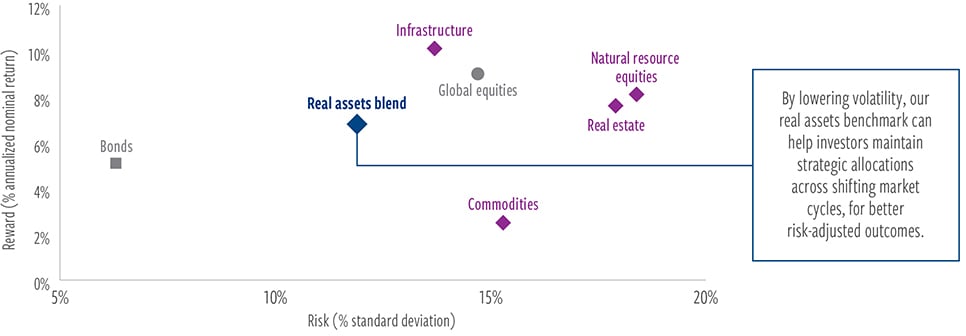
At June 30, 2026. Source: Barclays, Bloomberg, Dow Jones, FTSE, S&P, Refinitiv Datastream, Cohen & Steers.
Data quoted represents past performance, which is no guarantee of future results. The information presented above does not reflect the performance of any fund or other account managed or serviced by Cohen & Steers, and there is no guarantee that investors will experience the type of performance reflected above. Return reflects compound annualized return. Risk reflects annualized standard deviation of monthly returns. There is no guarantee that any historical trend illustrated above will be repeated in the future, and there is no way to predict precisely when such a trend will begin. Strategies that trade in commodities involve a risk of loss. Please refer to the Index Associations and Definitions page for important information on the index proxies.
Bottom-up security selection is our primary alpha engine
With our strategic architecture established, the largest share of active risk comes from bottom-up security selection within each real assets sleeve. Our firm-wide team of more than 60 real assets specialists seeks to identify opportunities at the security and commodity levels, where wide dispersion between winners and laggards creates fertile ground for active management (Exhibit 4).
Indeed, this wide return dispersion is a hallmark of real assets, whose underlying securities are often highly heterogeneous. Two securities in the same sector can differ materially in asset quality, contractual protections, financing needs, regulatory treatment, operating leverage and sensitivity to commodity prices. These differences create wide ranges of potential outcomes and attractive opportunities for fundamental analysis to add value.
Consider the implications of rising electricity demand for infrastructure investors. Analyzing electric utilities requires a detailed understanding of regulatory frameworks that vary significantly by state and country. These frameworks can directly affect a utility’s inflation sensitivity and relative performance potential. As concerns about electricity affordability grow, understanding regulatory nuances, including regulators’ willingness and ability to approve rate increases, is critical to assessing risk and identifying durable sources of alpha.
EXHIBIT 4
Wide dispersion creates opportunity for active selection
Real assets sector calendar year security-level dispersion
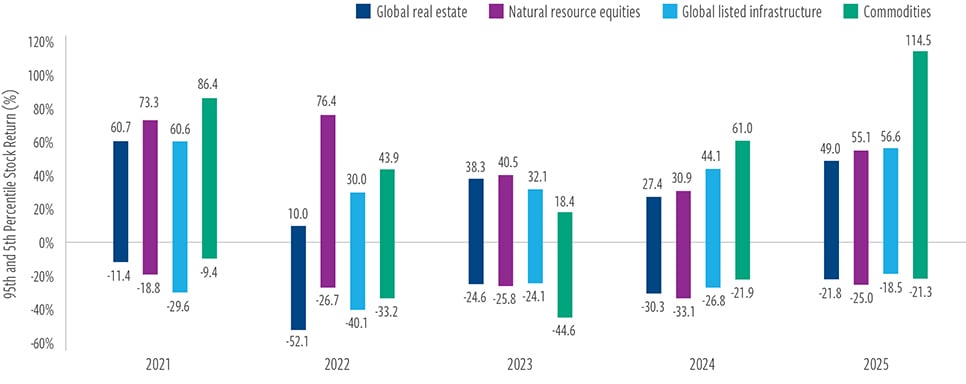
At December 31, 2025. Source: Cohen & Steers.
Please refer to the Index Associations and Definitions page for important information on the index proxies.
Similar rate-setting issues are playing out across Europe, Japan and other markets, but with distinct policy dynamics and bottom-up considerations. Evaluating these differences favors local market knowledge, policy expertise and fundamental research.
These granular insights also inform risk management across the broader portfolio. Consider energy exposure. If our infrastructure, natural resource equity and commodity teams are all increasing exposures to oil- related risks, we may need to recalibrate the aggregate position. Sharing security-level insights across teams helps us identify correlated exposures and portfolio risks that headline asset-class weights may obscure.
Secular megatrends broaden the opportunity set
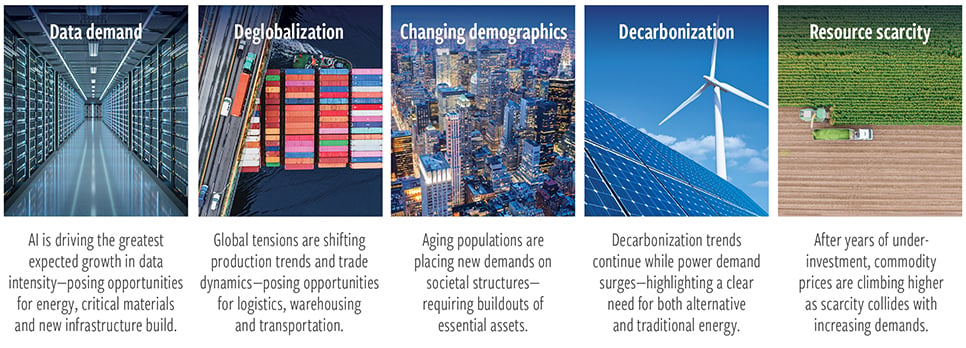
The AI revolution is creating significant opportunities across real assets— for example, in electric utilities delivering power to hyperscalers, data center landlords providing digital infrastructure, and miners producing copper and other critical materials. But rising data demand is only one of several secular forces reshaping the real assets opportunity set (Exhibit 5).
Supply chain realignment, demographic change, decarbonization and energy addition, and chronic resource scarcity are also transforming risks and opportunities across real estate, infrastructure, natural resource equities and commodities. These structural forces create a deep and evolving opportunity set for our specialist teams to apply fundamental research and active security selection.
EXHIBIT 5
Five secular forces shaping real assets investments
At June 30, 2026. Source: BCG, Cohen & Steers.
Top-down allocations are flexible, but anchored
Top-down allocation provides a third layer of active management, although it typically plays a more measured role in alpha generation. We adjust sleeve weights primarily in response to relative valuations, with a bias toward statistically inexpensive assets, while also considering macroeconomic conditions, momentum, portfolio risks and bottom-up insights from our specialist teams.
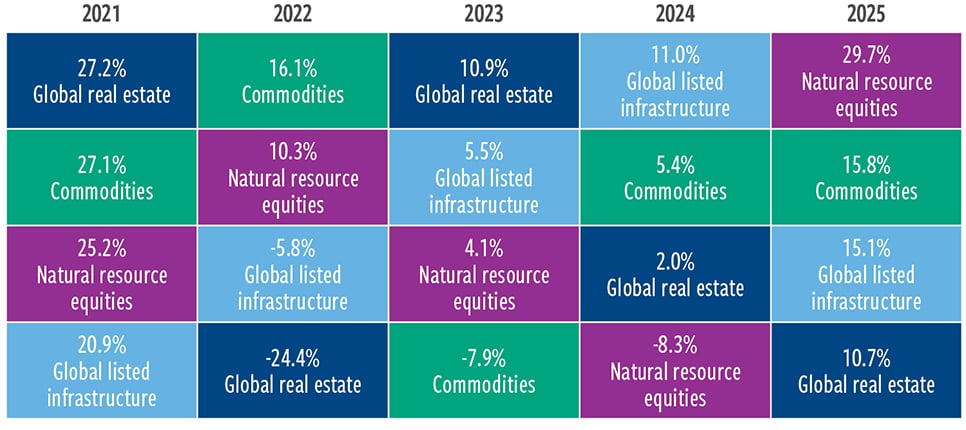
Performance leadership has historically rotated meaningfully from year to year (Exhibit 6), creating opportunities for top-down allocation to add value. Capturing those opportunities, however, is not as simple as increasing exposure to recent winners and reducing exposure to laggards. Leadership can reverse quickly. Because exact turning points are difficult to identify in real time, large allocation shifts can introduce more volatility than investors are prepared to accept.
The objective of our top-down allocations is to improve upon the strategic benchmark, not to pursue a series of concentrated macro trades. Large shifts into and out of individual sleeves can unintentionally weaken important portfolio characteristics, such as inflation sensitivity.
EXHIBIT 6
Leadership across real assets categories changes frequently
Calendar year returns
At June 30, 2026. Source: Cohen & Steers.
Please refer to the Index Associations and Definitions page for important information on the index proxies.
Commodities illustrate this risk (see sidebar). Reducing commodity exposure to increase allocations to higher-returning categories may improve near- term return potential, but it can also materially weaken the portfolio’s ability to respond to an unexpected inflation shock. In today’s era of scarcity and heightened geopolitical risk, we believe a more measured approach to dynamic allocation is especially relevant.
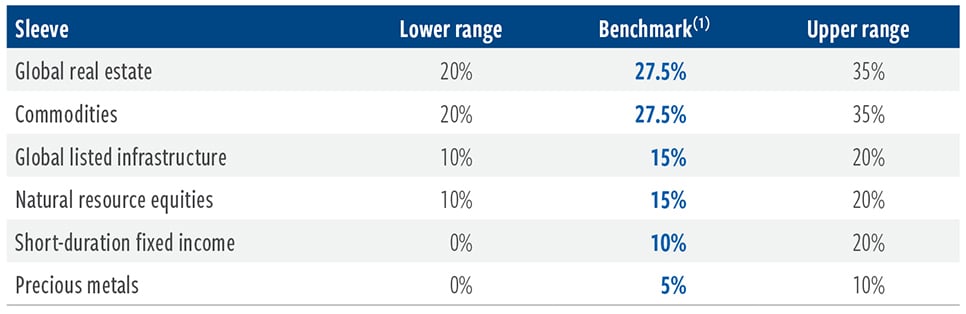
Our permitted allocation ranges nevertheless provide meaningful room to express conviction, with minimum and maximum weights helping preserve the integrity of the strategic blend (Exhibit 7).
These ranges represent capacity, not targets. Allocations may remain close to their benchmark weights when expected returns don’t justify using the full risk budget, or when macroeconomic and market signals conflict. This restraint is intentional. Active allocation decisions should enhance, never undermine, the portfolio’s three core objectives: inflation sensitivity, diversification and long-term return potential.
EXHIBIT 7
Strategic benchmark weights and permitted allocation ranges
At June 30, 2026. Source: Cohen & Steers.
(1) The real assets benchmark is represented by a blend comprised of 27.5% Real Estate, 27.5% Commodities, 15% Natural Resource Equities, 15% Infrastructure, 10% Short Duration Fixed Income and 5% Gold.
Inflation sensitivity should not depend on perfect timing
Inflation shocks are notoriously difficult to predict. During extended periods without an inflation surprise, highly inflation-sensitive assets such as commodities can lag other real asset categories.
These periods may tempt investors to reduce or eliminate commodity exposure and reallocate to recent market leaders. But if investors rely on tactical timing to restore that exposure, a sudden inflation shock can affect the portfolio far faster than they can reposition into commodities.
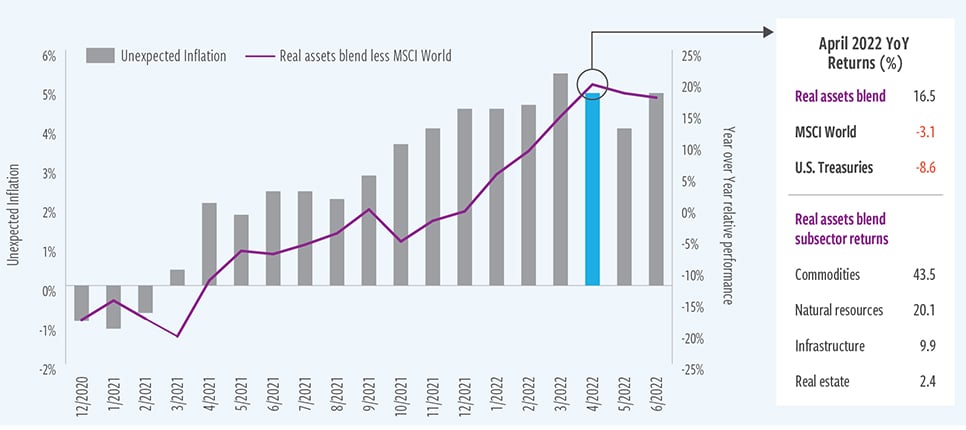
The inflationary period of 2021 and 2022 illustrates how our strategic real assets architecture can help prepare portfolios for unexpected shocks (Exhibit 8).
By April 2022, shortly after Russia’s invasion of Ukraine intensified pressures across energy and other commodity markets, the Bloomberg Commodity Index had returned 43.5% over the preceding 12 months. With commodities serving as a core anchor, our strategic benchmark returned 16.5% over the same period, outperforming the MSCI World Index by nearly 20 percentage points. This occurred as global equities declined and U.S. Treasuries faced significant pressure. Maintaining a strategic allocation to a diversified real assets portfolio provided meaningful portfolio benefits during the inflation shock.
This episode illustrates the value of maintaining inflation-sensitive exposures within the strategic architecture. It does not demonstrate perfect macroeconomic foresight. The benchmark entered the inflation shock with meaningful allocations to commodities and natural resource equities already in place. Top-down allocation may enhance results around that strategic foundation, but the portfolio does not depend on tactical decisions to establish commodity exposure at precisely the right time.
EXHIBIT 8
Strategic real asset exposure can matter during inflation shocks
At June 30, 2026. Source: Barclays, Bloomberg, Dow Jones, FTSE, S&P, Refinitiv Datastream and Cohen & Steers.
Please refer to the Index Associations and Definitions page for index definitions. Inflation is measured using the Consumer Prive Index (CPI) for all urban consumers, published by the United States Department of Labor’s Bureau of Labor Statistics. Rising inflation is measured as a positive year-over-year increase in the 12-month inflation rate. Unexpected inflation is measured as a positive difference between the year-over-year realized inflation rate and lagged 1-year ahead expected inflation. Expected inflation as measured reflects median inflation expectations from University of Michigan Survey of 1-Year Ahead Inflation Expectations. A real rate of return is the annual percentage return realized on an investment, which is adjusted for change in prices due to inflation.
Active management at three levels across real assets
The case for active management in real assets begins long before the first security is purchased. With no universally accepted blended benchmark, the first decision is what a real assets allocation should seek to achieve.
Our strategic architecture translates three investor objectives—inflation sensitivity, diversification and long-term return potential—into a balanced and durable benchmark. It does so by recognizing the distinct strengths and limitations of each real asset category.
While our architecture provides the foundation, bottom-up security selection is our primary alpha engine. Top-down allocation plays a more measured role, refining rather than redefining the strategy.
Architecture defines our mission. Our blended benchmark translates three key investor objectives into a durable strategic allocation.
Security selection drives alpha. Wide return dispersion and category- specific complexities create opportunities for specialist research to add value.
Top-down allocation refines the strategy. Relative value opportunities can justify disciplined shifts, but allocations remain benchmark-aware and bounded.
Together, these three active layers reinforce one another. Bottom- up insights inform portfolio-level risk decisions, top-down oversight manages exposures across sleeves, and strategic architecture keeps every active decision connected to the portfolio’s purpose: providing durable, investable real assets exposure within a broader stock and bond allocation.
Our active architecture is designed to complement portfolios across shifting economic cycles, during inflation shocks and throughout an investor’s time horizon.
Index definitions and important disclosures
Please consider the investment objectives, risks, charges and expenses of the Fund carefully before investing. A summary prospectus and prospectus containing this and other information may be obtained by visiting cohenandsteers.com or by calling 800 330 7348. Please read the summary prospectus and prospectus carefully before investing.
Investors should consider the investment objectives, risks, charges and expenses carefully before investing. For a prospectus or summary prospectus and other information about Cohen & Steers active ETFs, please call (866) 737-6370. Read the prospectus or summary prospectus carefully before investing.
An investor cannot invest directly in an index and index performance does not reflect the deduction of any fees, expenses or taxes. Index comparisons have limitations as volatility and other characteristics may differ from a particular investment.
Data quoted represents past performance, which is no guarantee of future results. There is no guarantee that any historical trend illustrated/referenced above will be repeated in the future, and there is no way to predict precisely when such a trend might begin. There is no guarantee that any market forecast set forth in this commentary will be realized. The views and opinions in the preceding commentary are as of the date of publication and are subject to change.
This material represents an assessment of the market environment at a specific point in time and should not be relied upon as investment advice, does not constitute a recommendation to buy or sell a security or other investment and is not intended to predict or depict performance of any investment. This material is not being provided in a fiduciary capacity and is not intended to recommend any investment policy or investment strategy or take into account the specific objectives or circumstances of any investor. We consider the information in this presentation to be accurate, but we do not represent that it is complete or should be relied upon as the sole source of appropriateness for investment. Please consult with your investment, tax or legal professional regarding your individual circumstances prior to investing. The views and opinions expressed are not necessarily those of any broker/dealer or its affiliates. Nothing discussed or suggested should be construed as permission to supersede or circumvent any broker/dealer policies, procedures, rules or guidelines.
Real assets blend: 27.5% real estate, 27.5% commodities, 15% infrastructure, 15% resource equities, 10% short-duration fixed income and 5% gold. Real estate: Datastream Developed Real Estate Index through 2/28/05; FTSE EPRA Nareit Developed Index thereafter. The Datastream Developed Real Estate Index encompasses listed real estate companies in developed markets and is compiled by Refinitiv Datastream. The FTSE EPRA Nareit Developed Index is an unmanaged market weighted total return index which consists of many companies from developed markets that derive more than half of their revenue from property-related activities. Commodities: S&P GSCI Index through 7/31/98; Bloomberg Commodity Total Return Index thereafter. The S&P GSCI Index is a composite of commodity sector returns representing an unleveraged, long-only investment in commodity futures that is broadly diversified across the spectrum of commodities, calculated on a fully collateralized basis with full reinvestment. The Bloomberg Commodity Total Return Index, formerly known as the Dow Jones-UBS Commodity Index, is a broadly diversified index that tracks the commodity markets through exchange-traded futures on physical commodities, which are weighted to account for economic significance and market liquidity. Infrastructure: 50/30/20 blend of Datastream World Gas, Water & Multi-Utilities, Datastream World Pipelines and Datastream World Railroads through 7/31/08; Dow Jones Brookfield Global Infrastructure Index thereafter. The Datastream World Index Series encompasses global indexes of companies in their respective sectors (Gas, Water & Multi-Utilities; Pipelines; and Railroads) and is compiled by Refinitiv Datastream. The Dow Jones Brookfield Global Infrastructure Index is a float- adjusted market-capitalization-weighted index that measures performance of globally domiciled companies that derive more than 70% of their cash flows from infrastructure lines of business. Resource equities: 50/50 Blend of Datastream World Oil & Gas and Datastream World Basic Materials through 5/31/08; S&P Global Natural Resources Index thereafter. The Datastream World Index Series encompasses global indexes of companies in their respective sectors (Datastream World Oil & Gas and Datastream World Basic Materials) compiled by Refinitiv Datastream. The S&P Global Natural Resources Index includes 90 of the largest publicly traded companies in natural resources and commodities businesses that meet specific investability requirements, offering investors diversified, liquid and investable equity exposure across three primary commodity-related sectors: Agribusiness, Energy and Metals & Mining. Short-duration fixed income: The ICE BofA 1–3 Year U.S. Corporate Index tracks the performance of USD-denominated investment-grade corporate debt publicly issued in the U.S. domestic market with a remaining term to maturity of less than 3 years. Gold: Gold spot price in USD per Troy ounce. Global stocks: MSCI World Index, a market-capitalization-weighted index consisting of a wide selection of stocks traded in 24 developed markets. U.S. bonds: The ICE BofA U.S. Treasury 7-10 Year Bond Index measures the performance of public obligations of the U.S. Treasury that have a remaining maturity of greater than 7 years and less than or equal to 10 years.
Alpha: Alpha is the difference between an investment’s actual returns and its expected performance, given its level of risk, as measured by beta. Positive/negative alpha indicates that an investment has performed better/worse than its beta would predict. High alpha is an indication of good active management.
RISKS A real assets strategy is subject to the risk that its asset allocations may not achieve the desired risk-return characteristic, underperform other similar investment strategies or cause an investor to lose money. The risks of investing in REITs are similar to those associated with direct investments in real estate securities. Property values may fall due to increasing vacancies, declining rents resulting from economic, legal, tax, political or technological developments, lack of liquidity, limited diversification and sensitivity to certain economic factors such as interest rate changes and market recessions. An investment in commodity-linked derivative instruments may be subject to greater volatility than investments in traditional securities, particularly if the instruments involve leverage. The value of commodity-linked derivative instruments may be affected by changes in overall market movements, commodity index volatility, changes in interest rates, or factors affecting a particular industry or commodity, such as drought, floods, weather, livestock disease, embargoes, tariffs and international economic, political and regulatory developments. The use of derivatives presents risks different from, and possibly greater than, the risks associated with investing directly in traditional securities. Among the risks presented are market risk, credit risk, counterparty risk, leverage risk and liquidity risk. The use of derivatives can lead to losses because of adverse movements in the price or value of the underlying asset, index or rate, which may be magnified by certain features of the derivatives.
The market value of securities of natural resource companies may be affected by numerous factors, including events occurring in nature, inflationary pressures and international politics. Global infrastructure securities may be subject to regulation by various governmental authorities, such as rates charged to customers, operational or other mishaps, tariffs and changes in tax laws, regulatory policies and accounting standards. Foreign securities involve special risks, including currency fluctuation and lower liquidity. Because the strategy invests significantly in natural resource companies, there is the risk that the strategy will perform poorly during a downturn in the natural resource sector. The Fund must meet certain diversification requirements under the U.S. tax laws. No representation or warranty is made as to the efficacy of any particular strategy or fund or the actual returns that may be achieved.
Futures Trading Is Volatile, Highly Leveraged and May Be Illiquid. Investments in commodity futures contracts and options on commodity futures contracts have a high degree of price variability and are subject to rapid and substantial price changes. Such investments could incur significant losses. There can be no assurance that the options strategy will be successful. The use of options on commodity futures contracts is to enhance risk-adjusted total returns. The use of options, however, may not provide any, or only partial, protection for market declines. The return performance of the commodity futures contracts may not parallel the performance of the commodities or indexes that serve as the basis for the options it buys or sells; this basis risk may reduce overall returns.
The Cohen & Steers ETFs are distributed by Foreside Fund Services, LLC. Foreside Fund Services, LLC is not affiliated with Cohen & Steers. Cohen & Steers U.S. registered open-end funds are distributed by Cohen & Steers Securities, LLC, and are only available to U.S. residents.