
Real assets—including real estate, infrastructure, commodities and resource equities—may offer an effective solution amid inflation and valuation risks.
KEY TAKEAWAYS
- A shifting global landscape
In our view, real assets are well positioned as the world transitions to what we see as an era of scarcity, with more inflation risk and commodity undersupply colliding with growing demand. - Why real assets
A blend of real assets offers the potential for some level of inflation sensitivity, diversification and enhanced risk-adjusted returns, with lower historical volatility than individual real assets. - Why now
Real assets are trading at attractive valuations relative to equities. This, combined with high and broad-based inflation and compelling secular forces is raising awareness of their potential benefits.
An essential allocation for a new market regime
Investors today face a much more difficult return environment than they’ve experienced in recent decades, and diversifying beyond stocks and bonds is likely to become increasingly important. Compared to the last 10 years, we forecast slower real growth, stubbornly high inflation and greater volatility over the next decade. The result will likely be lower profit margins and lower returns for the broad equity market. We believe bonds are likely to be more volatile as this happens, making them less effective in counteracting the volatility of stocks. In contrast, we believe real assets are well positioned as the world transitions from an era of abundance to what we see as an era of scarcity, characterized by persistent inflation risk, supply shocks, commodity underinvestment, protectionism and geopolitical uncertainty. These and other factors are converging to imply a favorable environment across real assets. In particular we highlight:
Data demand. Artificial intelligence (AI) is driving the greatest expected growth in data intensity in history. Infrastructure and real estate companies own utilities, data centers and cell towers that are essential to support this growth, which is brightening the longer-term demand outlook for power generation and technology-related assets. We believe real assets owners offer a more attractively valued way to access the AI theme compared with direct AI plays such as chip makers.
Deglobalization. Geopolitical tensions are shifting production trends and trade dynamics. Amid friendshoring and reshoring, we see growth opportunities for owners and operators of assets along the logistics chain, including industrial warehouses (global real estate) and freight rails and marine ports (global infrastructure)
Valuations and broader market participation are potential tailwinds for real assets.
Changing demographics. Aging populations are placing new demands on societal structures. Capital investment is required to build out essential assets owned by infrastructure companies, as well as senior living and health care facilities owned by real estate landlords.
Decarbonization. Decarbonization trends continue, yet growth in market share takes time. Meanwhile, power demand continues to grow, increasing demand for all energy sources. In our view, this “energy addition” thesis stands to benefit both alternative and traditional sources of energy, ranging from solar and wind to natural gas and nuclear.
Resource scarcity. Commodities, we believe, will see a meaningful improvement in returns as we move from persistent oversupply to a period of prolonged undersupply. After years of under-investment, commodity prices are likely to be driven higher as relative scarcity meets with higher demand: there is a massive growing global middle class, with the developing world starting to meaningfully consume more commodities. These factors work to the potential benefit of not only commodities, but also the listed natural resource companies that produce them.
As real assets continue to move past their worst decade on record relative to the broad equity market (2011–2021), valuations remain generally attractive compared with recent history. Global real estate, listed infrastructure and natural resource equities are all on the inexpensive side relative to their history, whereas equities are expensive relative to their history. Hence, the ratio of real assets classes to broad equities is especially compelling (Exhibit 1, right hand side).
In an environment likely to be defined by persistent inflation, these factors are potentially setting the stage for significant real assets outperformance in the years ahead. We recognize the challenge to resist FOMO, or the fear of missing out, whereby many investors tend to stick with what’s worked in the past, including AI-related stocks, expecting it to work in the future. But it’s common to see reversals of fortune. Returns are often mean reverting, with starting valuations being key to future performance.
With U.S. mega-cap tech names appearing priced for perfection, there may be little margin of safety if pillars of AI narrative begin to sway. We see potential for rotation into more value-oriented themes, including real assets, especially if economic growth continues to see broader participation, not just dominated by AI and high income consumption (Exhibit 1, left hand side).
EXHIBIT 1
Broadening of growth supports more value-oriented themes
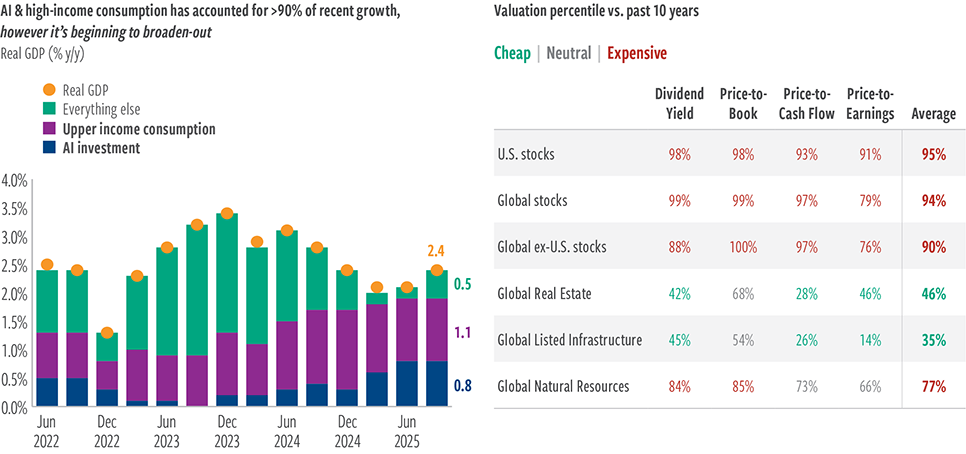
At December 31, 2025. Source: Haver, UBS and Cohen & Steers.
Past performance is no guarantee of future results. Left-hand-side graph: assumes upper income accounts for 40-60% of consumption. Upper income is defined as the top quintile of wage earners. Right-hand-side table: Long-term median measured since 1995 Asset class proxies defined on the index definitions page.
The views and opinions are as of the date of publication and are subject to change without notice. There is no guarantee that any market forecast set forth in this presentation will be realized. There is no guarantee that any historical trend illustrated above will be repeated in the future, and there is no way to predict precisely when such a trend might begin. See page 11 for index associations, definitions and additional disclosures.
As we look back on 2025, it was clearly a defining year for real assets. While much of the market’s attention remained focused on the AI boom, real assets had a stand-out year, with virtually all categories generating double-digit returns. Looking ahead, our macro-economic outlook remains constructive, as we are above consensus on global growth (even though absolute growth may slow over the long term), inflation, and interest rates, and expect economic activity and market returns to broaden after several years of unusually concentrated gains. We see growth being supported by strength in China and emerging markets, alongside continued resilience in the U.S., with a more accommodative monetary policy backdrop and the potential for incremental fiscal support.
The economic backdrop suggests continued strength in real assets.
On rates, we believe 10-year nominal yields will rise from resilient growth, sticky inflation, and elevated sovereign issuance. In our base case, the increase comes primarily from higher inflation expectations. With respect to real (inflation-adjusted) yields, we expect them to fall over the course of this year to our current year-end 2026 target of 1.75%. This all points to what we believe is a favorable backdrop for real assets. As indicated in Exhibit 2, periods when real (inflation-adjusted) yields fall and inflation breakevens are rising (which is what we anticipate), have historically resulted in strong relative and absolute returns for real assets. We believe the historical outperformance of traditional stock/bond portfolios when inflation expectations rise reflects the inherent inflation beta real assets can deliver—a feature unmatched by stocks and bonds.
EXHIBIT 2
Current market backdrop has historically favored real assets performance
Average annualized 6m rolling total returns based on coincident change in 10yr yields and breakevens (December 2002–December 2025)
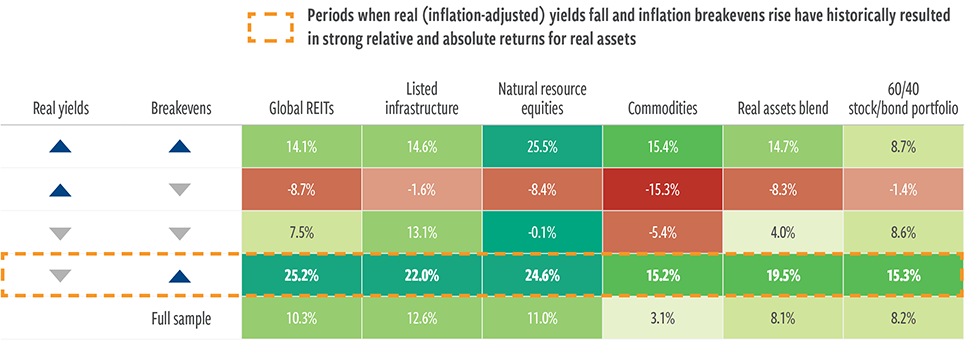
At December 31, 2025. Source: Bloomberg, LSEG Datastream, Cohen & Steers.
Performance represented by Global REITs: FTSE EPRA Nareit Developed Real Estate Index. Infrastructure: 50/30/20 blend of Datastream World Gas, Water & Multi-Utilities, Datastream World Pipelines and Datastream World Railroads through 12/31/02; Dow Jones Brookfield Global Infrastructure Index thereafter. Natural resource equities: 50/50 blend of Datastream World Oil & Gas and Datastream World Basic Materials through 12/31/02; S&P Global Natural Resources Index thereafter.
Commodities: Bloomberg Commodity Total Return Index. 60/40 stock/bond allocation: 60% MSCI World Index and 40% ICE BofA US Treasury 7-10 Year Bond Index. Real assets blend: 27.5% real estate, 27.5% commodities, 15% natural resource equities, 15% infrastructure, 10% short-duration fixed income and 5% gold. Short-duration fixed income represented by ICE BofA 13 Year U.S. Corporate Index. Gold represented by the gold spot price in U.S. dollars per troy ounce. The real assets blend is not representative of an actual portfolio and is for illustrative purposes only. See page 11 for index associations, definitions and additional disclosures.
Why real assets
Three potential benefits
Real assets are the structures and raw materials that economies rely on to function and be productive. That includes the properties where we live, work and shop; the infrastructure that provides power and water and enables transportation and
communications; and the basic natural resources, such as food and energy, that sustain societies. Products that invest in publicly traded (listed) markets offer a convenient way to access the global opportunity set of real assets, capturing the underlying economics of these investments with the added benefit of liquidity.
A diversified blend of real assets—including real estate securities, listed infrastructure, commodities and natural resource equities— may help enhance a portfolio in three key ways:
- Positive inflation sensitivity to help mitigate the potentially damaging effects of accelerating inflation.
- Diversification potential from distinct performance drivers that typically result in low correlations, both among real assets categories and vs. stocks and bonds.
- Attractive return potential over full market cycles, with a history of attractive risk-adjusted performance.
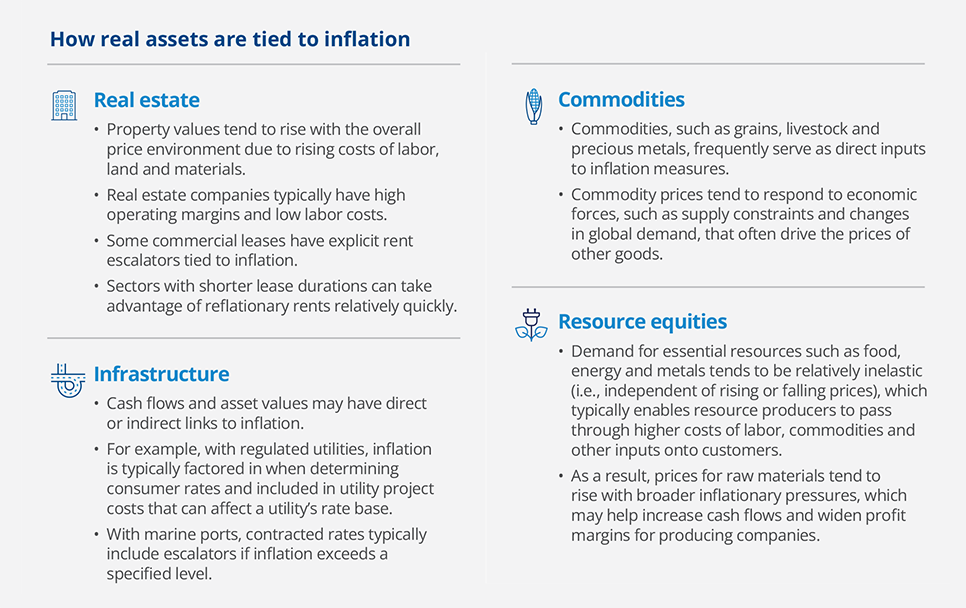
Inflation sensitivity
The economic drivers of real assets are often directly or indirectly tied to inflationary trends, historically resulting in outsized returns when inflation exceeds expectations (and relative underperformance when inflation is low). For example, the release of pent-up consumer demand, which is one of the drivers of inflation today, stands to benefit assets that struggled the most early in the pandemic such as commodities, natural resource equities, real estate and infrastructure.
An allocation to a blend of real assets may help preserve future purchasing power, potentially offsetting the weak or even negative inflation sensitivity of traditional portfolios concentrated in stocks and bonds. The ability of real assets to counter inflation may have an impact on portfolios both today, as prices climb, and longer-term if elevated inflation persists.
Diversification potential
The goal of portfolio diversification is to own asset classes that tend to experience their above- and below-average returns in different economic and market environments—when one asset zigs, the expectation is that another will zag. Real assets’ distinct economic sensitivities tend to differentiate them from traditional risk assets such as stocks and bonds.
The historical benefits of having differentiated economic drivers can be seen in real assets’ “beta,” which is their sensitivity to the broad global equity market (Exhibit 3). A beta of more than 1 indicates that the asset class (over the timeframe being analyzed) exhibits more volatility than the broad equity market. A beta of less than 1 indicates that the asset class tends to behave differently or be less volatile than the market. In this case, the low market beta of real assets suggests significant diversification potential, which may help to reduce portfolio volatility—and, we believe, improve risk-adjusted returns.
EXHIBIT 3
Low market beta of real assets suggests significant diversification potential
Beta to global equities 1991–Q4 2025
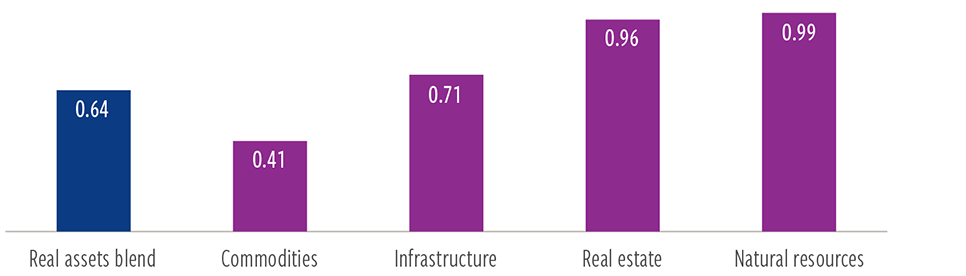
At December 31, 2025. Source: Barclays, Bloomberg, Dow Jones, FTSE, S&P, Refinitiv Datastream and Cohen & Steers.
Past performance is no guarantee of future results. The information presented above does not reflect the performance of any fund or other account managed or serviced by Cohen & Steers, and there is no guarantee that investors will experience the type of performance reflected above. There is no guarantee that any historical trend illustrated above will be repeated in the future, and there is no way to predict precisely when such a trend will begin. Diversification does not ensure a profit or protect against loss. Strategies that trade in commodities involve a risk of loss. See page 11 for index associations, definitions and additional disclosures.
Attractive risk-adjusted returns
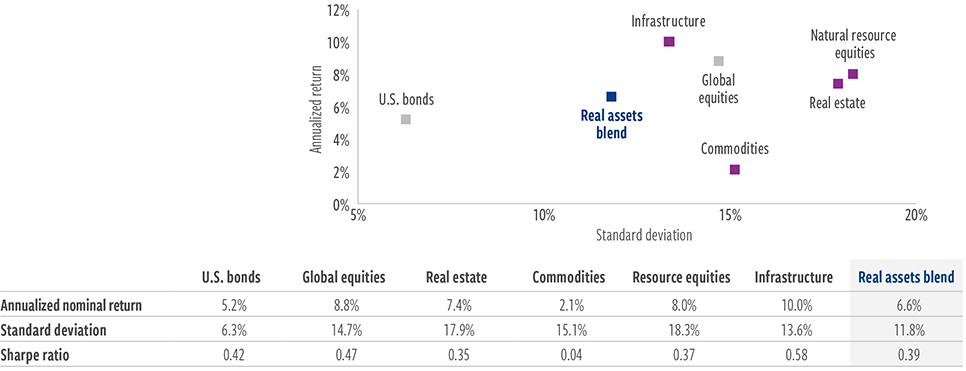
Real assets have historically delivered attractive full-cycle returns that can potentially improve risk-adjusted portfolio returns without sacrificing growth potential. Over the last 35 years, a blend of real assets has exhibited returns competitive to those of global stocks, but with lower volatility (Exhibit 4).
EXHIBIT 4
Historically attractive risk profile from real assets
Since 1991, a real assets blend has exhibited favorable risk-adjusted return.
Benefits of the blend
A diversified blend of real assets may offer an effective way for investors to target common objectives of a real assets allocation—such as boosting inflation sensitivity, enhancing diversification and improving the risk-return profile. (Exhibit 5).
EXHIBIT 5
Together
Matching real assets characteristics to portfolio objectives
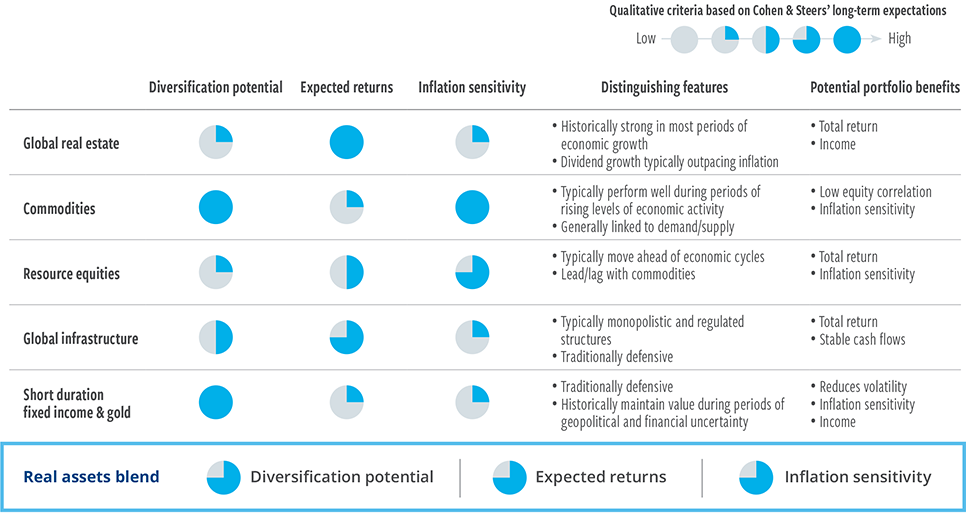
At December 31, 2025. Based on Cohen & Steers analysis and expectations.
There is no guarantee that any market forecast set forth in this presentation will be realized. The views and opinions are as of the date of publication and are subject to change without notice. The mention of specific sectors is not a recommendation or solicitation to buy or hold securities in a particular sector and should not be relied upon as investment advice. The qualitative criteria in the above chart represent relative strengths across the real asset categories discussed in this presentation, based on realized historical data since June 1991 and Cohen & Steers’ expectations.
Why now
Macro backdrop may favor real assets
We believe today’s low relative prices are just one reason why the recovery in real assets may still have time to run. Potential catalysts for a longer period of outperformance include:
- Supply shortages across labor, product and commodity markets continue to impact inflation dynamics, with supply-side discipline in commodities production expected to persist.
- The combination of elevated public spending and peak globalization may sustain higher inflation over the coming decade, potentially weighing on stock and bond returns.
- Risk markets have been propelled by expectation of dovish central bank policy backdrop—led by the U.S. Fed—combined with an extended boom in AI-related investment will sustain U.S. and global growth trajectory.
- However, while stimulating into a bull market likely keeps recession risks at bay, we expect a corresponding (as yet unpriced) pickup in inflation
Within an economy characterized by a regime shift toward higher inflation, and real assets generally trading at compelling valuations relative to stocks, an allocation may offer an effective way to boost inflation sensitivity, enhance diversification and improve a risk-return profile.
The Cohen & Steers advantage
We specialize as a firm in real assets and alternative income, and have the team, resources, and investment expertise in house that position us well to pursue alpha. We take a blended approach to real assets, managing the major categories as a single strategy. We have delivered consistent outperformance over the long term, through different market environments, including extreme periods such as the energy downturn, COVID, and geopolitical upheavals.
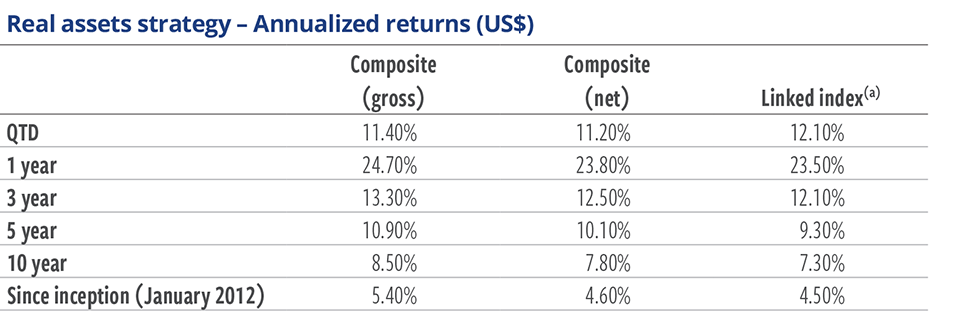
At March 31, 2026. Source: Cohen & Steers.
Past performance is no guarantee of future results.
(a) Linked Index: The linked blended index consists of 30% Bloomberg Commodity Total Return Index, 30% FTSE EPRA Nareit Developed Real Estate Index-net, 20% S&P Global Natural Resources Index-net, 12.5% ICE BofA 1-3 Year Global Corporate Index, and 7.5% Gold Spot price from 1/31/2012 through 9/30/2013; and by 27.5% FTSE EPRA Nareit Developed Real Estate Index-net, 27.5% Bloomberg Commodity Total Return Index, 15% S&P Global Natural Resources Index-net, 10% ICE BofA 1-3 Year U.S. Corporate Index, 5% Gold Spot price and 15% Dow Jones-Brookfield Global Infrastructure Index from 10/1/2013 and thereafter. See page 11 for index associations, definitions and additional disclosures.
Why the commodities recovery may continue
Russia’s invasion of Ukraine in early 2022 has thrown a spotlight on commodities as virtually every sector—from energy to agriculture to metals—has surged on supply concerns stemming from the war. While a welcome de-escalation of the conflict could cause commodities to pull back for a spell, we believe the macroeconomic conditions that have driven many commodity prices to multi-year highs could remain very constructive over the longer term. We believe the potential for a lasting economic recovery bodes well for an extended period of strong commodity consumption.
Inventories for most commodities were at multi-year lows before the pandemic hit, leaving producers scrambling to meet the now surging demand as economies reopen. A lack of investment in supply in recent years means ramping up output will take time. Also, Covid-related production issues and supply chain constraints that plagued many sectors during the pandemic (particularly metals) are still lingering.
After a challenging decade for commodities, we see potential for a sustained, broad-based rally, driven by three key factors:
- A highly supportive macroeconomic backdrop
- The strongest supply/demand fundamentals in a decade
- Attractive portfolio benefits—including inflation sensitivity— driving speculative inflows
ABOUT THE AUTHORS

Vince Childers, CFA, Senior Vice President, is Head of Real Assets Multi-Strategy and a portfolio manager for Cohen & Steers’ real assets strategy.
Index definitions and important disclosures
An investor cannot invest directly in an index and index performance does not reflect the deduction of any fees, expenses or taxes. Index comparisons have limitations as volatility and other characteristics may differ from a particular investment.
Data quoted represents past performance, which is no guarantee of future results. There is no guarantee that any historical trend illustrated/referenced above will be repeated in the future, and there is no way to predict precisely when such a trend might begin. There is no guarantee that any market forecast set forth in this commentary will be realized. The views and opinions in the preceding commentary are as of the date of publication and are subject to change.
This material represents an assessment of the market environment at a specific point in time and should not be relied upon as investment advice, does not constitute a recommendation to buy or sell a security or other investment and is not intended to predict or depict performance of any investment. This material is not being provided in a fiduciary capacity and is not intended to recommend any investment policy or investment strategy or take into account the specific objectives or circumstances of any investor. We consider the information in this presentation to be accurate, but we do not represent that it is complete or should be relied upon as the sole source of appropriateness for investment. Please consult with your investment, tax or legal professional regarding your individual circumstances prior to investing. The views and opinions expressed are not necessarily those of any broker/dealer or its affiliates. Nothing discussed or suggested should be construed as permission to supersede or circumvent any broker/dealer policies, procedures, rules or guidelines.
Real assets blend: 27.5% real estate, 27.5% commodities, 15% infrastructure, 15% resource equities, 10% short-duration fixed income and 5% gold. Real estate: Datastream Developed Real Estate Index through 2/28/05; FTSE EPRA Nareit Developed Index thereafter. The Datastream Developed Real Estate Index encompasses listed real estate companies in developed markets and is compiled by Refinitiv Datastream. The FTSE EPRA Nareit Developed Index is an unmanaged market weighted total return index which
consists of many companies from developed markets that derive more than half of their revenue from property-related activities. Commodities: S&P GSCI Index through 7/31/98; Bloomberg Commodity Total Return Index thereafter. The S&P GSCI Index is a composite of commodity sector returns representing an unleveraged, long-only investment in commodity futures that is broadly diversified across the spectrum of commodities, calculated on a fully collateralized basis with full reinvestment. The Bloomberg Commodity Total Return Index, formerly known as the Dow Jones-UBS Commodity Index, is a broadly diversified index that tracks the commodity markets through exchange-traded futures on physical commodities, which are weighted to account for economic significance and market liquidity. Infrastructure: 50/30/20 blend of Datastream World Gas, Water & Multi-Utilities, Datastream World Pipelines and Datastream World Railroads through 7/31/08; Dow Jones Brookfield Global Infrastructure Index thereafter. The Datastream World Index Series encompasses global indexes of companies in their respective sectors (Gas, Water & Multi-Utilities; Pipelines; and Railroads) and is compiled by Refinitiv Datastream. The Dow Jones Brookfield Global Infrastructure Index is a floatadjusted market capitalization-weighted index that measures performance of globally domiciled companies that derive more than 70% of their cash flows from infrastructure lines of business. Resource equities: 50/50 Blend of Datastream World Oil & Gas and Datastream World Basic Materials through 5/31/08; S&P Global Natural Resources Index thereafter. The Datastream World Index Series encompasses global indexes of companies in their respective sectors (Datastream World Oil & Gas and Datastream World Basic Materials) compiled by Refinitiv Datastream. The S&P Global Natural Resources Index includes 90 of the largest publicly traded companies in natural resources and commodities businesses that meet specific investability requirements, offering investors diversified, liquid and investable equity exposure across three primary commodity related sectors: Agribusiness, Energy and Metals & Mining. Short-duration fixed income: The ICE BofA 1–3 Year U.S. Corporate Index tracks the performance of USD-denominated investment-grade corporate debt publicly issued in the U.S. domestic market with a remaining term to maturity of less than 3 years. Gold: Gold spot price in USD per Troy ounce. Global stocks: MSCI World Index, a market-capitalization-weighted index consisting of a wide selection of stocks traded in 24 developed markets. U.S. bonds: The ICE BofA U.S. Treasury 7-10 Year Bond Index measures the performance of public obligations of the U.S. Treasury that have a remaining maturity of greater than 7 years and less than or equal to 10 years.
RISKS A real assets strategy is subject to the risk that its asset allocations may not achieve the desired risk-return characteristic, underperform other similar investment strategies or cause an investor to lose money. The risks of investing in REITs are similar to those associated with direct investments in real estate securities. Property values may fall due to increasing vacancies, declining rents resulting from economic, legal, tax, political or technological developments, lack of liquidity, limited diversification and sensitivity to certain economic factors such as interest rate changes and market recessions. An investment in commodity-linked derivative instruments may be subject to greater volatility than investments in traditional securities, particularly if the instruments involve leverage. The value of commodity-linked derivative instruments may be affected by changes in overall market movements, commodity index volatility, changes in interest rates, or factors affecting a particular industry or commodity, such as drought, floods, weather, livestock disease, embargoes, tariffs and international economic, political and regulatory developments. The use of derivatives presents risks different from, and possibly greater than, the risks associated with investing directly in traditional securities. Among the risks presented are market risk, credit risk, counterparty risk, leverage risk and liquidity risk. The use of derivatives can lead to losses because of adverse movements in the price or value of the underlying asset, index or rate, which may
be magnified by certain features of the derivatives.
The market value of securities of natural resource companies may be affected by numerous factors, including events occurring in nature, inflationary pressures and international politics. Global infrastructure securities may be subject to regulation by various governmental authorities, such as rates charged to customers, operational or other mishaps, tariffs and changes in tax laws, regulatory policies and accounting standards. Foreign securities involve special risks, including currency fluctuation and lower liquidity. Because the strategy invests significantly in natural resource companies, there is the risk that the strategy will perform poorly during a downturn in the natural resource sector. The Fund must meet certain diversification requirements under the U.S. tax laws. No representation or warranty is made as to the efficacy of any particular strategy or fund or the actual returns that may be achieved.
Futures Trading Is Volatile, Highly Leveraged and May Be Illiquid. Investments in commodity futures contracts and options on commodity futures contracts have a high degree of price variability and are subject to rapid and substantial price changes. Such investments could incur significant losses. There can be no assurance that the options strategy will be successful. The use of options on commodity futures contracts is to enhance risk-adjusted total returns. The use of options, however, may not
provide any, or only partial, protection for market declines. The return performance of the commodity futures contracts may not parallel the performance of the commodities or indexes that serve as the basis for the options it buys or sells; this basis risk may reduce overall returns.
Cohen & Steers Capital Management, Inc. (Cohen & Steers) is a U.S. registered investment advisory firm that provides investment management services to corporate retirement, public and union retirement plans, U.S. endowments, foundations and mutual funds. Cohen & Steers Asia Limited is authorized and regulated by the Securities and Futures Commission of Hong Kong (ALZ367). Cohen & Steers Japan Limited is a registered financial instruments operator (investment advisory and agency business and discretionary investment management business with the Financial Services Agency of Japan and the Kanto Local Finance Bureau No. 3157) and is a member of the Japan Investment Advisers Association. Cohen & Steers Ireland Limited is regulated by the Central Bank of Ireland (No.C188319). Cohen & Steers UK Limited is authorized and regulated by the Financial Conduct Authority (FRN458459). Cohen & Steers Singapore Private Limited is a private company limited by shares in the Republic of Singapore.
For readers in the Middle East: This document is for informational purposes only. It does not constitute or form part of any marketing initiative, any offer to issue or sell, or any solicitation of any offer to subscribe or purchase, any products, strategies or other services, nor shall it or the fact of its distribution form the basis of, or be relied on in connection with, any contract resulting therefrom. In the event the recipient of this document wishes to receive further information with regard to any products, strategies or other services, it shall specifically request the same in writing from us.