

We believe vertically integrated utilities are structurally better positioned than transmission & distribution utilities to convert fast-rising power demand into rate base and earnings growth, which may lead to significant performance dispersion.
KEY TAKEAWAYS
- A demand inflection meets two distinct business models
The electricity demand growth story is real, durable and significant. Most notably, U.S. power demand has inflected into structural growth after two decades of stagnation, forcing a major investment cycle across utilities and adjacent infrastructure. How that demand translates into earnings depends on market structure. - Power generation is driving investment growth in this cycle
Because vertically integrated utilities earn a regulated return on both electricity production and wires infrastructure, they capture a substantially larger share of the investment required to serve new data center load, supporting faster rate base and earnings growth than transmission & distribution peers. - Active security selection across both models remains essential
While certain utilities are positioned for once-in-a-generation growth acceleration, a company’s business model is just one investment consideration. Selective positioning based on numerous fundamental factors can potentially uncover the best opportunities across the entire utility universe.
A demand inflection meets two distinct business models
After roughly two decades of flat consumption, U.S. electricity demand has entered a period of structural growth. We expect U.S. power demand to grow by more than 3% annually through 2030, driven by AI-focused data centers, the reshoring of manufacturing, and broad electrification.
Utilities, which represent approximately half of the global listed infrastructure universe, are front and center as they work to meet this demand. Some utilities are planning for load growth several times the size of their current peak demand; one large southeastern United States utility now expects roughly 80% of its incremental demand over the next decade to come from data centers.
How that demand translates into utility earnings depends on market structure.
In the U.S., roughly two-thirds of states retain a traditional, vertically integrated utility model, in which a single regulated utility owns generation, transmission and distribution and plans for evolving supply/demand dynamics under state commission oversight (Exhibit 1). The remainder, concentrated in the Northeast, Mid-Atlantic, Texas and California, separate deregulated (and competitive) generation assets from regulated “wires” companies that deliver power but generally do not own power plants.
Both business models can potentially thrive as demand rises, but the integrated model is positioned to capture a larger share of the investment and earnings growth this cycle.
EXHIBIT 1
Two markets, two business models
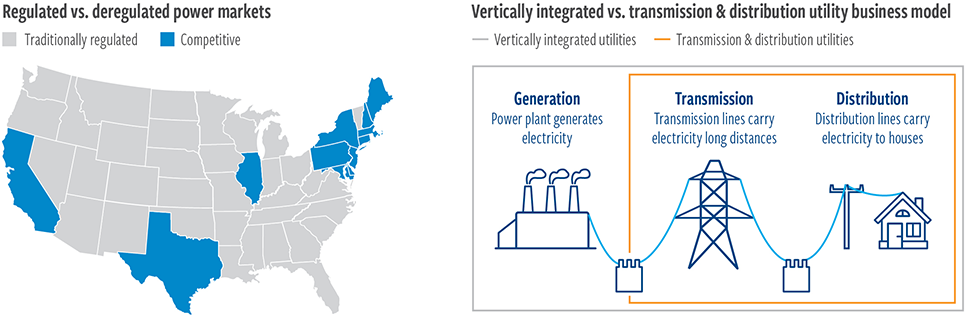
At August 31, 2026. Source: U.S. Environmental Protection Agency, Cohen & Steers.
Certain exceptions apply in select transmission & distribution markets
How we got here: A brief history of two utility systems
The vertically integrated, state-regulated utility emerged in the early 20th century as a compact: exclusive service territories and the ability to earn a fair return in exchange for an obligation to serve all customers at regulated rates. That framework, reinforced by the Public Utility Holding Company Act of 1935, governed the industry for more than six decades.
Deregulation arrived in stages. The Public Utility Regulatory Policies Act of 1978 opened generation to non-utility producers, while the Energy Policy Act of 1992 and FERC Orders 888 and 889 (1996) expanded access to transmission networks and fostered wholesale competition.
Beginning in the mid-1990s, many states restructured retail markets, requiring incumbent utilities to divest or ring-fence power generation assets. The hope was that competitive power producers would operate more efficiently than regulated monopolies, ultimately lowering the cost of electricity generation. The California power crisis of 2000–2001, which included rolling blackouts, price spikes and utility bankruptcies, undermined the case for deregulation.
No state has restructured since, leaving the country durably split between the two models.
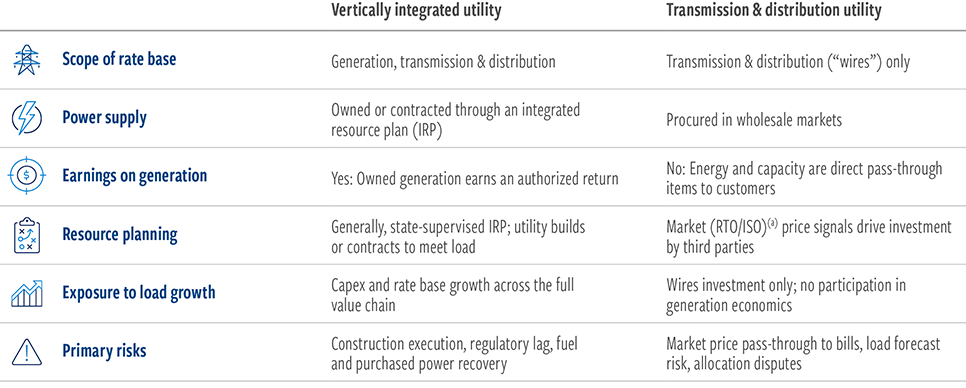
Importantly, restructuring was designed for an era of abundance: flat demand and surplus capacity, when market discipline from generators plausibly lowered costs for consumers. Today, the key question is how each model performs in an era of scarcity, where the challenge is no longer managing excess capacity but financing and deploying new supply at an unprecedented pace (Exhibit 2).
EXHIBIT 2
The business model determines exposure to the buildout
At August 31, 2026. Source: Cohen & Steers.
Individual company structures vary; several holding companies own both integrated and wires-only subsidiaries. (a) Regional transmission organization or independent system operator.
Generation is driving investment growth in this cycle
Serving new demand can require significant investment across the value chain, but the segments of that value chain are not created equally. New dispatchable generation is by far the most capital-intensive component: The installed cost of a new combined-cycle gas plant has risen sharply amid turbine backlogs and labor inflation. Renewables, nuclear and battery storage additions carry their own substantial costs and risks. Transmission interconnection and network upgrades, while significant, typically represent only a fraction of the capital required to actually produce the power.
The mechanics of regulated returns explain why this matters so much for shareholders. A utility’s earnings are determined by its rate base, which is the depreciated value of the assets it has prudently invested to serve customers. Regulators allow the utility to recover its operating costs plus a return on that rate base, with the return dependent on its approved capital structure and allowed return on equity (ROE). Utilities can therefore grow earnings by expanding their rate base through investments in transmission, distribution and generation infrastructure.
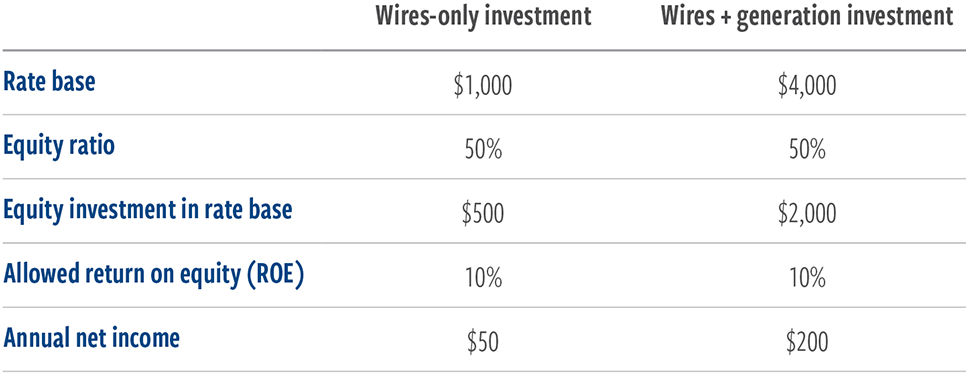
Consider a utility with $1,000 of rate base, a 50% equity ratio and a 10% allowed ROE. The equity content underpinning that rate base is $500 ($1,000 x 50%), and annual net income is $50 ($500 x 10%). All other costs of the utility (interest expense, maintenance, employees) are added on and charged to the customer base as the utility’s “revenue requirement.”
Now suppose serving a new data center requires $1,000 of wires investment but $3,000 of additional generation investment to actually produce the power. A transmission and distribution (T&D) utility captures only the wires investment: $1,000 of new rate base and $50 of incremental net income. A vertically integrated utility capturing the full $4,000 earns $200, or four times the income from serving the same customer (Exhibit 3). Generation, as the most capital-intensive segment of the value chain, is where the rate base growth, and therefore the earnings growth, is concentrated.
EXHIBIT 3
Generation is much more capital intensive than wires investment
Illustrative rate base economics of serving a data center
At August 31, 2026. Source: Cohen & Steers.
Hypothetical example for illustrative purposes only; assumes identical regulatory parameters. The generation-to-wires investment ratio varies by project and jurisdiction. Does not represent any actual investment or predict any outcome.
For the T&D utility, the remainder of the story is a pass-through: The energy and capacity required to serve that customer are procured in wholesale markets and flow through bills at cost, with no earnings attached. The result is a durable growth differential. Integrated utilities in high-growth jurisdictions are announcing some of the largest capital investment programs in the industry’s history, which is expected to lead to substantial earnings growth, while T&D utilities cannot accelerate earnings growth to the same degree.
Integrated markets should have an edge in the AI buildout
Hyperscale developers prioritize speed-to-power, supply certainty and a single accountable counterparty. The integrated model offers all three: a single utility controls the generation queue, the transmission plan and the ultimate tariff, while the state integrated resource planning process provides a forum for approving new resources years in advance. Unsurprisingly, some of the largest data center pipelines are now concentrated in vertically integrated regions, including the Southeast, the Carolinas, the Gulf Coast and the interior West.
That is not to say data centers will avoid deregulated markets. Texas continues to attract flexible loads that can tolerate market price exposure and political uncertainty. There are still large data center pipelines in the Mid-Atlantic and Midwest in the PJM Interconnection, the nation’s largest wholesale market, despite significant uncertainty around future rulemaking that could impact power markets.
But at the margin, the incremental gigawatt may increasingly be sited where a regulated utility can commit to building the required infrastructure. Newly designed large-load (read: data center) tariffs in integrated states, which impose minimum-take provisions, long-term contracts and credit support, also give commissions a mechanism to shield residential customers from data center-related costs, preserving the political durability of growth in a way that market-based pass-throughs cannot.
EXHIBIT 4
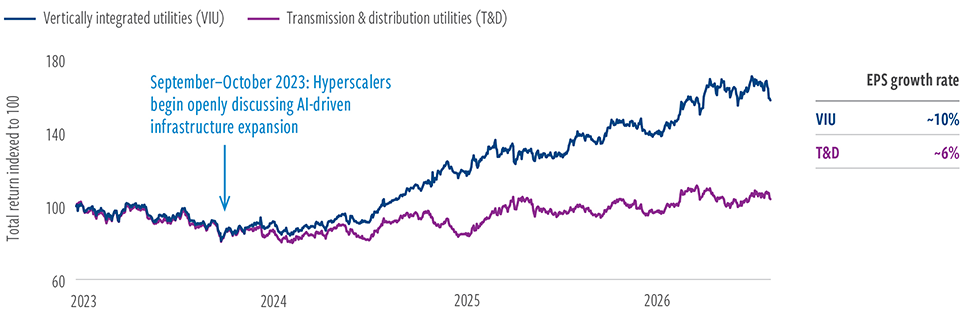
Vertically integrated utilities have led in the AI data center buildout
Performance of selected utilities by model type
At August 31, 2026. Source: Bloomberg
Past performance is no guarantee of future results. Returns are indexed to 100 at January 3, 2023. Vertically integrated utilities represented by stock tickers ETR, LNT, AEE, EVRG and NI; transmission & distribution utilities represented by ED, EXC and ES. Expected 5-year compound annual growth rates based on company estimates.
The affordability challenge in restructured markets
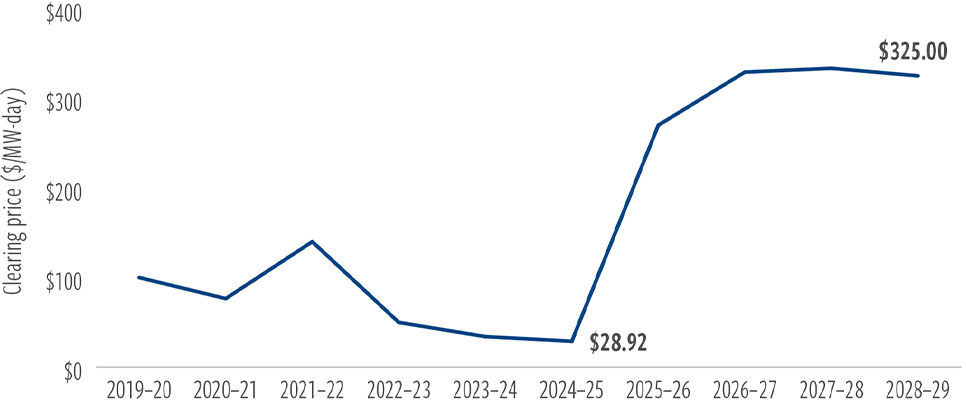
Unlike in integrated markets, where the generation component of customer bills is subject to regulatory approval, power prices in restructured states are set by market forces. As supply has tightened relative to demand, it has translated into higher customer bills in T&D states. For example, in the PJM Interconnection, capacity prices—the component of customer bills reflecting power plant availability payments alone—have risen from under $30/MW-day for the 2024/2025 delivery year to the administratively capped level of roughly $330/ MW-day in the most recent auctions, a more than tenfold increase (Exhibit 5).
Notably, prices in deregulated states have risen so sharply that regulators are now intervening to temper volatility through administrative price caps, an ironic outcome for markets designed to rely on competitive price formation. Despite higher power and capacity prices, independent power producers remain disincentivized to build new merchant generation, as they risk cannibalizing their existing fleet.
For wires utilities in these markets, the dynamic is especially challenging: customer bills rise materially, but the driver is a pass-through cost on which the utility earns nothing. The resulting affordability pressure affects the utility’s relationship with regulators and customers, raising scrutiny of rate cases, return authorizations and cost allocation with no offsetting earnings benefit. Several T&D utilities in restructured states are now exploring building generation through non-regulated affiliates contracted directly with data centers. Managed prudently, this is a thoughtful strategy that adds a new earnings driver while creating needed supply.
This is a challenge of market design, not company quality. T&D utilities retain important strengths: They generally offer a lower-risk version of the regulated model, with stable, predictable earnings; no exposure to large-scale generation construction and steady capital deployment into the wires, including significant transmission investment as regional grids expand to accommodate load growth.
Even so, the relationship between customer affordability and market structure is increasingly apparent. Bill pressure is building fastest in restructured markets, even though much of the recent increase stems from the generation portion of the bill rather than the regulated delivery component.
EXHIBIT 5
Rising capacity prices highlight affordability challenges in restructured markets
PJM capacity auction clearing prices
At August 31, 2026. Source: PJM Interconnection, Monitoring Analytics, public reports
Regional transmission organization (RTO)-wide clearing prices; constrained zones cleared higher in 2025/2026. Prices for 2026/2027 through 2028/2029 reflect the price cap. (a) The price cap for 2028/2029 declined slightly due to a mechanical adjustment in capacity accreditation, not due to lessening supply/demand fundamentals.
Finally, consider the alternative in a regulated market, where large new loads can put downward pressure on existing customers’ bills. A utility’s revenue requirement is dominated by fixed costs, primarily the grid itself, which are recovered across all kilowatt-hours sold. When a data center is added under an appropriately designed tariff, it contributes substantial new revenue that can more than offset the incremental cost to serve, spreading those fixed costs across a much larger sales base. Several integrated utilities have structured data center contracts with minimum-take provisions and dedicated rate classes specifically to ensure this benefit flows to existing customers rather than the other way around. The result is that load growth, which historically strained affordability, can, when managed well, become a tailwind for it.
Active security selection across both models is essential
We believe the vertically integrated utility model offers the more direct and larger claim on the capital cycle now underway: broader rate base participation, visible multi-year capital programs certified through integrated resource plans, contracted large-load tariffs that protect existing customers, and regulatory relationships forged through decades of infrastructure investment. The principal risks are execution and regulatory lag.
For T&D utilities, we continue to see a straightforward, relatively stable business model. There is less construction and execution risk; investors benefit from predictable capital deployment and lower earnings variability through market cycles. These characteristics can make T&D utilities a valuable component of a defensive allocation, even as integrated utilities offer greater potential upside to this cycle’s capital growth.
However, the open question is whether regulators and governors in restructured states will recognize that much of the recent bill pressure has been outside utilities’ control. Wires companies do not own the generation assets driving rates higher.
Utilities will need to attract historic amounts of capital to fund the grid investment ahead, and they can only do so if allowed returns remain competitive. Penalizing T&D utilities for costs they neither create nor collect could impair their access to capital markets at precisely the moment the system needs them to invest. Jurisdictions that recognize this distinction and treat their wires utilities fairly in the regulatory process will be best positioned to attract economic development.
For investors, opportunities are available across both utility models; the winners are unlikely to be determined by market structure alone. Regulatory support, capital allocation, balance sheet flexibility, service territory demographics, and the ability to execute large investment programs can all shape outcomes. As the power buildout accelerates, active management grounded in fundamental research can help identify companies with the strongest combination of growth, resilience and valuation potential across the utility universe.
ABOUT THE AUTHORS

Christopher DeNunzio, Vice President, is a portfolio manager on the Global Listed Infrastructure team.
Index definitions / important disclosures
An investor cannot invest directly in an index, and index performance does not reflect the deduction of any fees, expenses or taxes.
Past performance is no guarantee of future results. This material is for informational purposes and reflects prevailing conditions and our judgment as of this date, which are subject to change. There is no guarantee that any market forecast set forth in this presentation will be realized. This material represents an assessment of the market environment at a specific point in time and should not be relied upon as investment advice, does not constitute a recommendation to buy or sell a security or other investment, and is not intended to predict or depict the performance of any investment. This material is not being provided in a fiduciary capacity and is not intended to recommend any investment policy or investment strategy or to take into account the specific objectives or circumstances of any investor. We consider the information in this presentation to be accurate, but we do not represent that it is complete or should be relied upon as the sole source of appropriateness for investment. Please consult with your investment, tax or legal professional regarding your individual circumstances prior to investing.
Risks of investing in global listed infrastructure. Infrastructure issuers may be subject to regulation by various governmental authorities and may also be affected by governmental regulation of rates charged to customers; operational or other mishaps; tariffs; and changes in tax laws, regulatory policies and accounting standards. Foreign securities involve special risks, including currency fluctuations, lower liquidity, political and economic uncertainties, and differences in accounting standards. Some international securities may represent small and medium-sized companies, which may be more susceptible to price volatility and may have lower liquidity than larger companies.
Cohen & Steers Capital Management, Inc. (Cohen & Steers) is a U.S. registered investment advisory firm that provides investment management services to corporate retirement, public and union retirement plans, endowments, foundations and mutual funds. Cohen & Steers Asia Limited is authorized and regulated by the Securities and Futures Commission of Hong Kong (ALZ367). Cohen & Steers Japan Limited is a registered financial instruments operator (investment advisory and agency business and discretionary investment management business with the Financial Services Agency of Japan and the Kanto Local Finance Bureau No. 3157) and is a member of the Japan Investment Advisers Association.
Cohen & Steers UK Limited is authorized and regulated by the Financial Conduct Authority (FRN458459). Cohen & Steers Ireland Limited is regulated by the Central Bank of Ireland (No.C188319). Cohen & Steers Singapore Private Limited
is a private company limited by shares in the Republic of Singapore.
For recipients in the Middle East: This document is for informational purposes only. It does not constitute or form part of any marketing initiative or any offer to issue or sell (or any solicitation of any offer to subscribe or purchase) any products, strategies or other services, nor shall it or the fact of its distribution form the basis of, or be relied on in connection with, any contract resulting therefrom. In the event that the recipient of this document wishes to receive further information with regard to any products, strategies or other services, it shall specifically request the same in writing from us.
Publication Date: September 2026 Copyright © 2026 Cohen & Steers, Inc. All rights reserved.