

The first half of 2026 has reinforced real estate’s appeal, with listed and private markets benefiting from steady earnings, rising volumes and sector-specific opportunities against a backdrop of elevated risk.
KEY TAKEAWAYS
- A strong start and renewed optimism in listed and private
Amid macroeconomic uncertainty and high valuations in other asset classes, real estate’s stable cash flows and rising transaction volumes position it for ongoing favorable returns and resilience throughout 2026. - Sector spotlights: Recovery, risks and growth
Recovery and growth trends differ by sector. Data centers and senior housing lead, while apartment and self storage lag. AI demand and demographics shape outlooks amid sector-specific risks and opportunities. - Known unknowns lie ahead for investors
While policy and geopolitical volatility may persist, several headwinds for commercial real estate continue to ease in 2026, supporting the asset class’s appeal for income and portfolio diversification.
A strong start and renewed optimism in listed and private real estate
Real estate is off to a strong start in 2026, largely aligning with our annual outlook, which was constructive on both listed and private returns. In a market environment shaped by lower growth, greater macro uncertainty and lower expected returns from other asset classes (including broad equities and private credit), we believe real estate is well positioned for continued growth.
Equities (listed and private) remain at historically high valuations, and listed returns are increasingly concentrated in a handful of companies benefiting from an artificial intelligence (AI) capital spending surge. Credit spreads are near historical lows, offering limited protection should defaults rise or economic conditions worsen. Private credit, in particular, has begun to show early signs of strain. With the era of ultra-low rates now behind us, we see a less favorable risk/return profile across these markets.
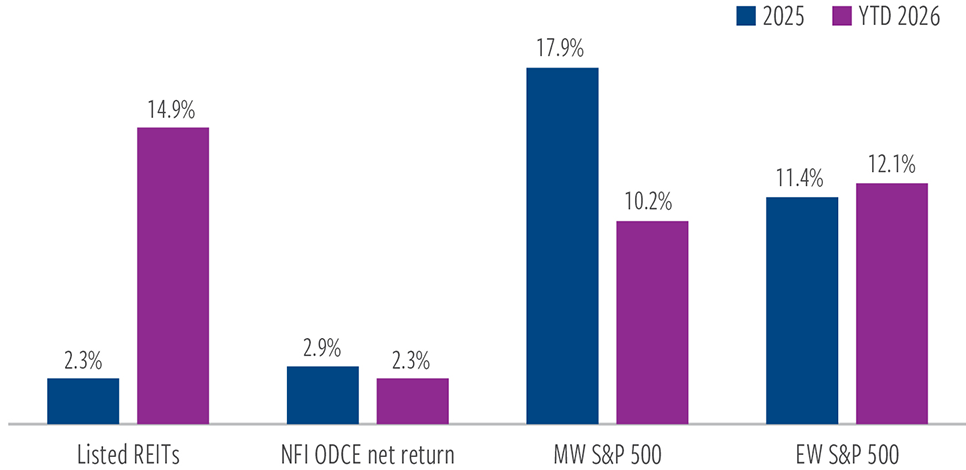
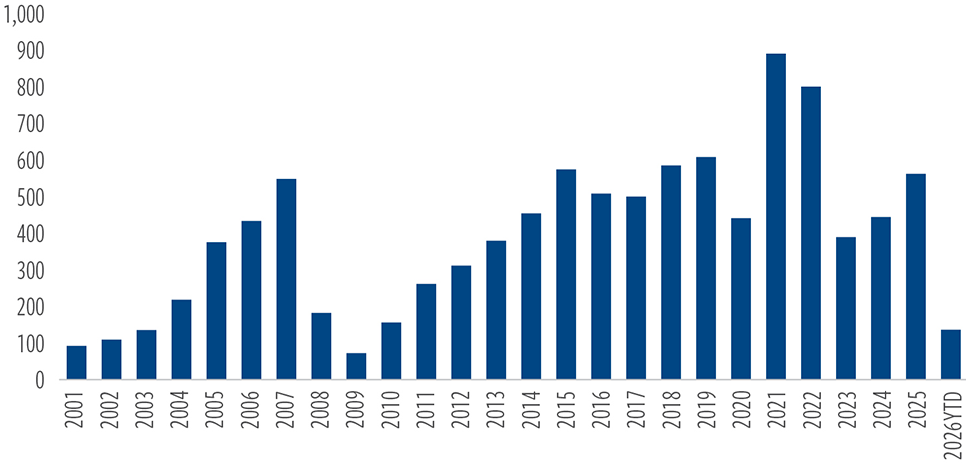
By contrast, real estate’s long-term performance has been underpinned by stable cash flows generated through leases with creditworthy tenants (Exhibit 1). At the same time, commercial real estate (CRE) transaction volumes are expected to increase for a third consecutive year, supported by improving supply/demand dynamics across a number of property types.
Early-year performance reinforces this view. U.S. private real estate, as measured by the NFI–ODCE index, returned 1% through the first quarter and has now posted seven consecutive quarters of gains. This followed negative returns for seven straight quarters, dating back to the end of 2022. We expect positive momentum to continue from here.
EXHIBIT 1
We expect real estate’s recent relative strength to continue
Return comparison, 2026 vs. 2025
At June 30, 2026. Source: Bloomberg, NCREIF.
Past performance is no guarantee of future results.
Listed real estate is up 14.9% through the second quarter on strong earnings and a resilient economic backdrop, despite rising stagflation concerns.
Roughly 80% of REITs exceeded consensus profit estimates in 1Q26, well above the period average of 55%; 60% raised full-year guidance, nearly double the typical pace.
Our outlook is unchanged, although the Iran conflict adds another exogenous risk, a year after the “Liberation Day” tariffs shock. U.S. real estate cash flow growth remains largely intact, despite higher interest rates. Like tariffs, it may fade from headlines but persist as a source of volatility.
The year-to-date returns have been uneven. Negative performance in March, driven by Iran-related uncertainty, was sandwiched by positive returns in January and February and a rebound in April, May and June. Beyond geopolitics, constructive trends are emerging across both listed and private real estate markets.
Real estate lagged equities in 2025, with REITs returning 2.3% versus the S&P 500’s 17.9%. Private market returns were 2.9%, below the 25-year average of 5.2%. Performance reflected the cumulative impact of 11 rate hikes since 2022 and higher real (inflation-adjusted) rates. Strong post-pandemic rent growth spurred new supply, pressuring fundamentals.
This drove a peak-to-trough decline in listed real estate of 33% and a 20% drop in private market values. Returns since then had been positive but modest. Despite the Federal Reserve beginning to cut rates in September 2024, the 10-year U.S. Treasury yield rose and stayed in a 4.0%–4.2% range for much of the second half of 2025, underscoring that easier financial conditions can be uneven, even as policy shifts.
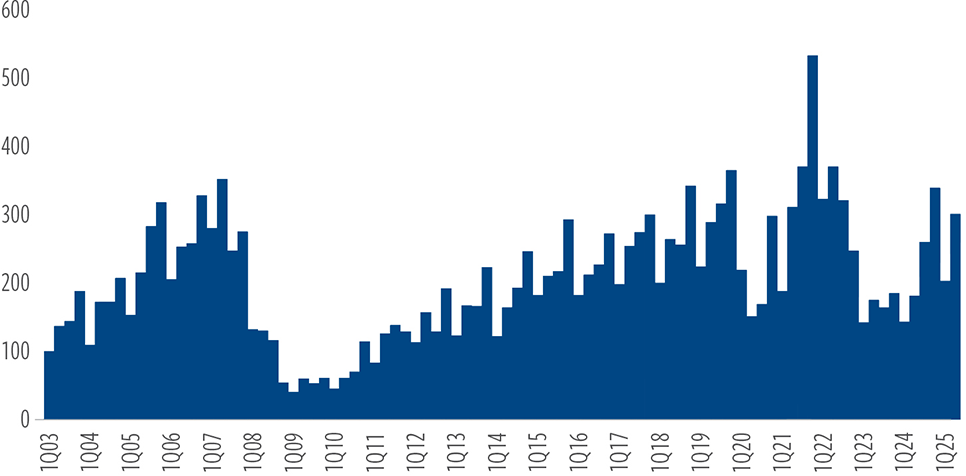
In 2026, conditions are improving, and this includes CRE credit. After two years of balance sheet adjustment following the Fed’s tightening cycle, banks have begun to reengage in CRE lending (Exhibit 2).
EXHIBIT 2
Fundamentals are strengthened by an improving credit market
CRE debt origination volume index (1Q03 = 100)
At May 31, 2026. Source: Mortgage Bankers Association.
Past performance is no guarantee of future results.
In their absence, life insurance companies and the CMBS market stepped in, a shift we expect to prove durable. Combined with improving debt availability and idle capital (i.e., raised but not deployed), this should support a third consecutive year of transaction growth in 2026 (Exhibit 3). The return of bank lending signals improving liquidity, a prerequisite for the transaction market’s recovery, price stabilization and, ultimately, the next phase of real estate returns.
Delinquencies from aggressively underwritten deals are likely to rise in 2026, particularly in the office sector, though ample sidelined capital should limit broader spillover to valuations.
While the market had anticipated additional rate cuts in 2026, our base case called for the 10-year U.S. Treasury yield to hold near current levels or move modestly higher, limiting cap rate compression. Initially out-of- consensus, this view has gained traction amid geopolitical tensions and more persistent inflation.
The recent rise in nominal rates reflects a mix of inflation and resilient growth, and is reshaping policy expectations, reintroducing the possibility of rate hikes. However, rising rates alongside healthy economic activity as we see today, typically support real estate fundamentals and rent growth—meaning higher yields also reflect demand-driven pricing power.
Even with the prospect of modest rate hikes, accelerating cash flow growth is likely to offset increased financing costs. Tight supply and strong demand are pushing rents higher, fueling income gains and above-average funds from operations (FFO) growth, which should help sustain overall return potential.
EXHIBIT 3
Debt availability and idle capital should support transaction growth
CRE transaction volumes ($ billions)
At March 31, 2026. Source: Real Capital Analytics.
Past performance is no guarantee of future results.
Sector spotlights: Recovery, risks and growth
Several themes have emerged in our outlooks across property types. Notably, while real estate prices are broadly in recovery, key questions remain as to the timing and pace of recovery, and the degree by which values are over- or underestimating the rebound.
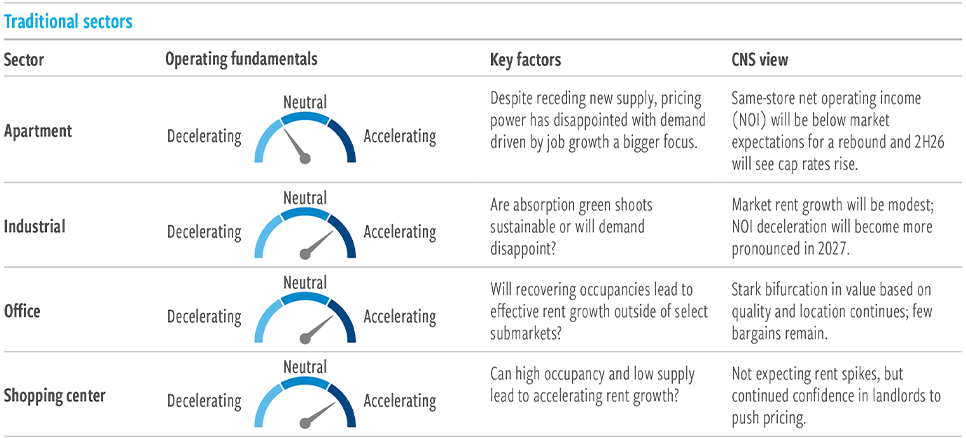
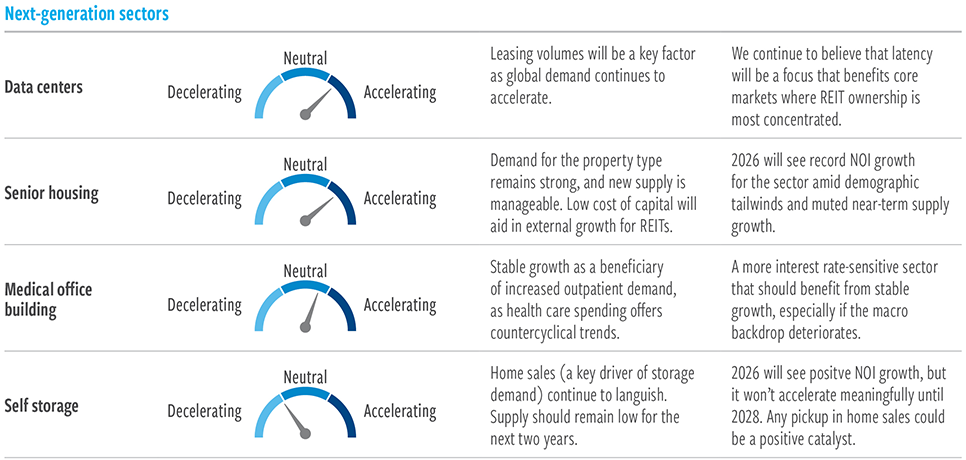
Overall, all four core sectors—shopping center, office, apartment and industrial—should see operating fundamentals trough or accelerate in 2026 (Exhibit 4). Outside of core property types, data centers and senior housing will show the strongest growth, while self storage is looking for a bottom in pricing power.
Thematically, we believe real estate is less exposed to global trade flows, meaning it should be less affected by tariffs—though some sectors, such as industrial and retail, may face more direct risks. A lower-supply environment should be supportive of rents and cash flows. We also have a preference for assets with strong secular growth profiles and pricing power.
We are cautious on some of the more economically sensitive sectors. Also, artificial intelligence may prove to be a headwind for certain asset classes, but we believe AI is a hardware story that requires enormous physical investment in power generation, grids, data centers, transportation, and raw materials. That will largely benefit many property types, while office may be at risk if hiring slows and demand drops.
Limited new supply is driving pricing power across many property types.
EXHIBIT 4
Current views of selected sectors
At June 30, 2026. Source: Cohen & Steers.
Apartments: Disappointing rent growth to drive falling private market values
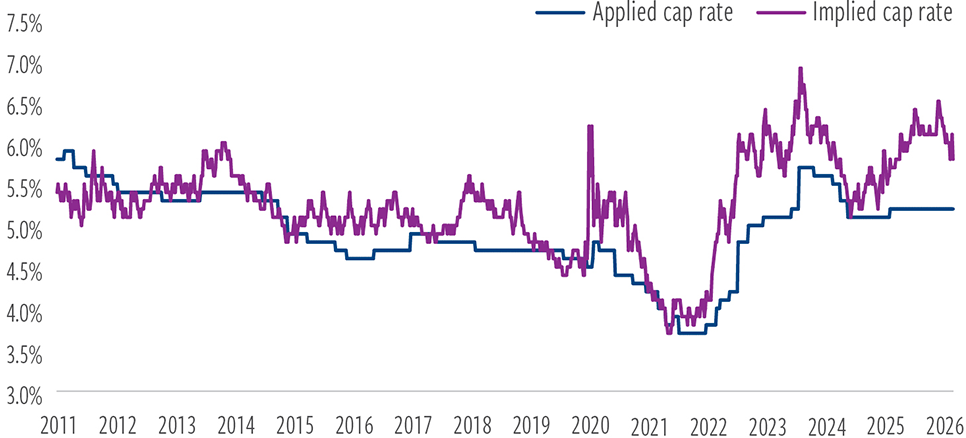
Throughout every cycle, dislocations emerge between public and private valuations across certain commercial real estate sectors. This cycle’s most pronounced divergence has been in apartments, where we expect private market cap rates to rise and values to decline through 2026 and 2027.
Listed apartments have traded at sizable discounts to gross asset value for nearly two years, with the spread between implied public and applied private cap rates near historically wide levels (Exhibit 5). Optimists argue that once record supply subsides, private’s internal growth rates will reaccelerate above trend. We expect a more modest recovery that will fall short of investor expectations.
While cost of homeownership and slowing supply are positives for operating fundamentals, we believe these are largely priced in. Growth is more likely to normalize as the renting-age cohort contracts, rising recent graduate unemployment tempers demand, and slower job growth constrains landlords’ ability to push rents.
Chasing the prior cycle’s winners is a familiar pattern, but as softer demand and weaker fundamentals become more evident in 2026, private market cap rates are likely to rise and values to adjust lower. Public markets already reflect this repricing in apartment valuations.
EXHIBIT 5
Private market apartment valuation reset likely
Apartment applied vs. implied cap rates
At June 26, 2026. Source: Green Street, Cohen & Steers.
Past performance is no guarantee of future results.
Industrial: Mixed signals as long-term demand meets accelerated supply
Industrial experienced one of the strongest pandemic-era re-ratings. Prior to the e-commerce surge, which was amplified by Covid-driven consumption and last-mile logistics, cap rates averaged 50 basis points (bps) above those of traditional sectors (apartment, office and retail). At the peak of enthusiasm, private market industrial cap rates compressed to nearly 200 bps inside traditional sectors. That spread has since moderated to roughly 125 bps as supply accelerated and pricing power softened. Despite emerging growth concerns, private market investor demand for industrial assets has remained resilient (Exhibit 6).
Tariff-related headwinds now appear less severe than initially feared.
Leasing tours and activity have improved steadily since the Liberation Day announcements, though they remain below pre-tariff levels. Tenants can only delay decisions for so long; operational needs are ultimately bringing them back to the market despite lingering macro uncertainty.
The public market reacted swiftly to the April 2025 tariff announcement, initially repricing the sector lower. But industrial REITs have since rebounded and outperformed from the mid-April trough. Implied cap rates are now below where they stood before tariffs were announced.
Unlike with apartments, listed investors appear willing to underwrite lower industrial cap rates than the private market, signaling confidence that fundamentals have not only bottomed but will accelerate this year. Our estimates include healthy mark-to-market rent growth, translating into NOI growth that will beat most sectors. However, at an implied cap rate of around 5%, operations will have to significantly exceed expectations to justify a more bullish view.
We believe sustained investor appetite will continue to support private market industrial valuations through 2026. Capital remains available and is being deployed at cap rates in the low-5% range. As mark-to-market rent growth decelerates, cap rates will rise, but any meaningful repricing is more likely to occur beyond 2026.
EXHIBIT 6
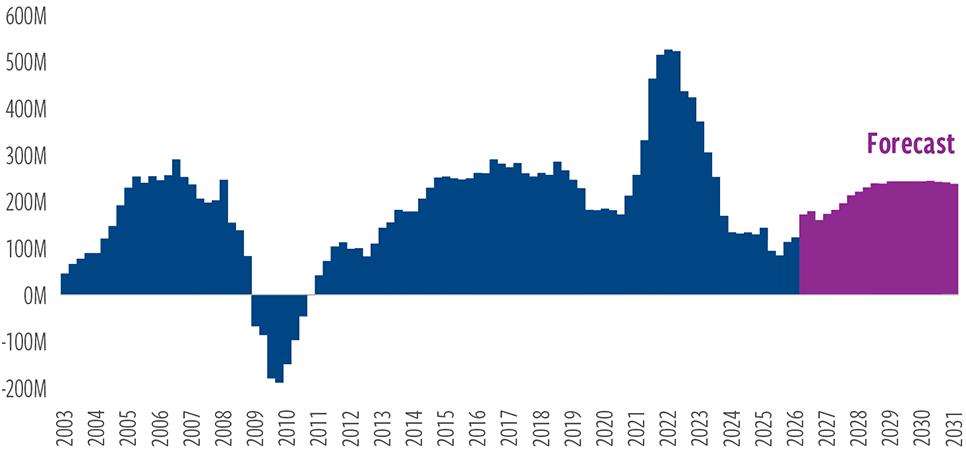
Absorption has bottomed and is accelerating
U.S. industrial absorption
At March 31, 2026. Source: CoStar, Cohen & Steers.
Past performance is no guarantee of future results. Forecasts are inherently limited. There is no guarantee that any market forecast will be realized.
Office: Select opportunities are emerging
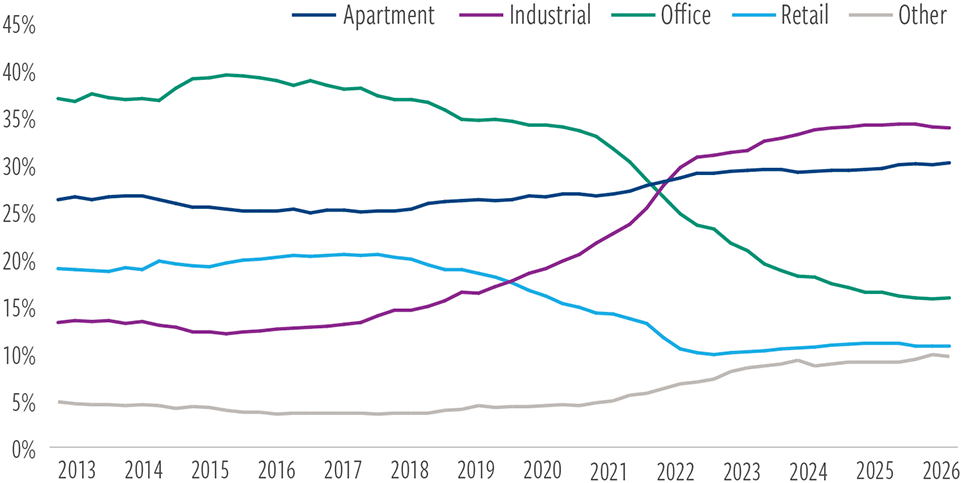
Describing office as a tale of haves and have-nots feels both consensus and repetitive, but the degree of bifurcation by quality and location is difficult to overstate (and, arguably, rivaled historically only by malls during the rise of e-commerce). Despite broad agreement that high-quality office buildings are gaining share from less amenitized and capitalized buildings, that trend will persist in 2026.
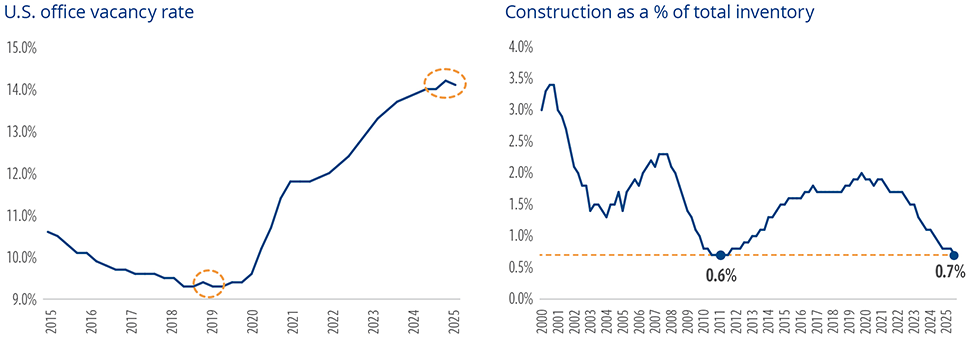
There are emerging signs of stabilization (Exhibit 7). Return-to-office mandates, combined with removal of obsolete stock, have driven the first decline in vacancy rates since 2019. At the same time, the sharp deterioration in fundamentals during the pandemic has curtailed new development; space under construction now sits at levels not seen since the global financial crisis.
We expect 2026 to be defined by a sorting across three main categories. First, buildings that require prohibitive capital to remain competitive and will be removed from inventory through demolition or conversion. Second, deeply discounted properties may offer buyers a basis to reinvest and compete for occupancy. Third, newer, well-located assets should command premium rents as occupancy improves and supply remains constrained. Indications in the private market are that the latter are already trading at valuations offering few bargains and little room for error on long-term underwriting.
EXHIBIT 7
Falling vacancies and limited supply support office rent growth
At March 31, 2026. Source: CoStar, Cohen & Steers.
Past performance is no guarantee of future results.
Listed office assets have consistently traded below private market valuations. Prior to the pandemic, the dislocation was largely driven by the public market’s understanding of the full-cycle capital expenditures required to sustain competitive rent growth. Work-from-home pressures exacerbated these challenges. While lower supply and more stabilized demand have improved visibility for higher-quality asset valuations, private market pricing still appears to underappreciate the long-term capital burden of maintaining competitiveness.
Public markets also appear more attuned to potential risks that AI adoption poses to white-colar employment. Of course, while AI could reduce overall demand due to productivity gains, it may also shift demand toward higher-quality assets. The ultimate impact is difficult to quantify given the unknowns surrounding AI efficiency gains, but it is a factor worth monitoring.
Although new supply is likely to be limited, investors should consider the risk of obsolescence even among today’s top-tier assets. Buildings leased to high-credit tenants today may face competition from the next generation of supply when leases roll in 10–15 years. This dynamic complicates full-cycle ownership.
EXHIBIT 8
Once a core holding, institutional demand for office has declined
Historical core % allocation
At March 31, 2026. Source: CoStar, Cohen & Steers.
Past performance is no guarantee of future results.
Shopping center: Slow and steady momentum is building
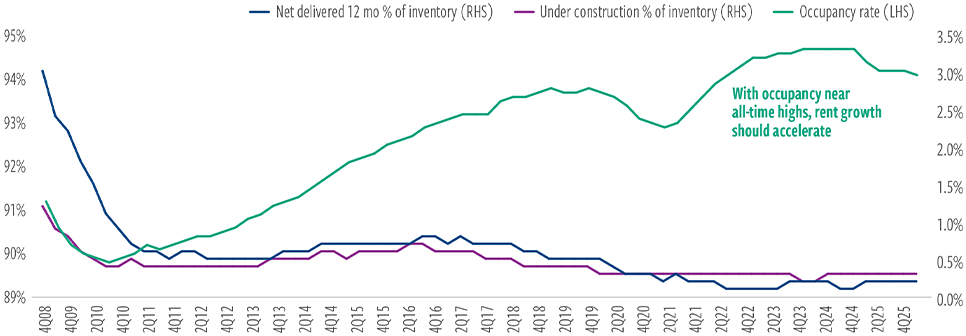
After spending much of the last two decades out of favor, shopping center retail has slowly regained traction, supported by improving fundamentals and renewed private market interest. New construction remains near record lows, while assets continue to trade at meaningful discounts to replacement cost—limiting the risk of future competitive new supply (Exhibit 9).
Occupancy has held near peak levels for the better part of the last two years following a modest dip from retailer bankruptcies in 2024. Even after normalizing for the post-pandemic rebound in NOI growth, the past three years represent the highest sustained growth period over the last 25 years. Private market investors have taken notice, and it has become one of the better performing core sectors. Debt markets have also reopened, reflecting confidence in the sector’s positive attributes. Among core sectors, shopping centers appear best positioned for cap rate compression based on these factors.
A cluster of retailer bankruptcies at the end of 2024—including Joann, Party City and Big Lots—weighed a bit on 2025 occupancy. However, fewer bankruptcies recently should equate to occupancy growth, supporting improved landlord pricing power. If economic growth broadens to benefit smaller businesses, inline tenants could emerge as a more meaningful source of incremental demand.
EXHIBIT 9
Shopping center are enjoying pricing power with occupancy near record highs
U.S. shopping center supply and occupancy
At March 31, 2026. Source: CoStar.
Past performance is no guarantee of future results.
Data centers: High demand amid AI surge driving a better year in 2026
Data center REIT performance in 2025 disappointed investors, as headlines around surging sector capex contrasted with muted equity returns. Even with the underperformance in 2025, it is worth remembering that since Nvidia signaled the AI-led demand for semiconductors, Digital Realty returned more than 70%.
While this lags far behind Nvidia’s 500%+ return, it comfortably exceeds the broader REIT market’s 21% return through year-end 2025. Notably, much of the announced data center investment has been directed toward secondary markets where public REITs have limited exposure.
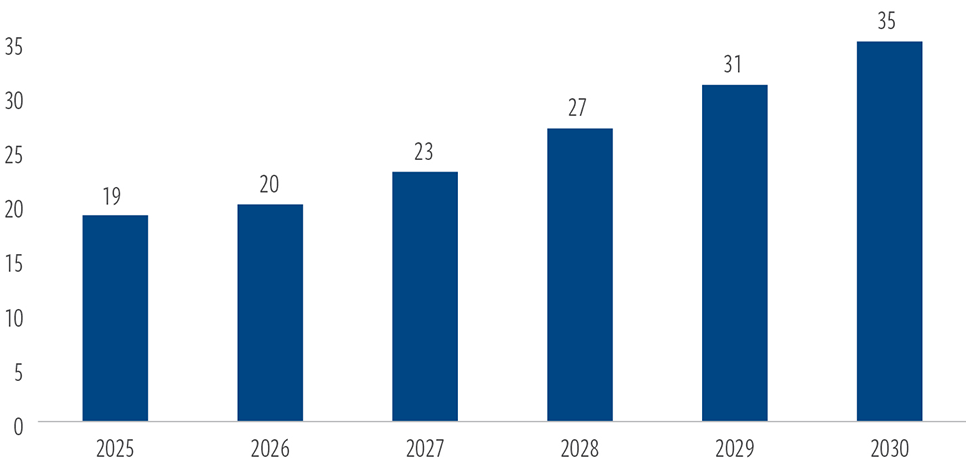
Meanwhile, major data center tenants continue to accelerate spending, with a combined $650 billion in planned capex for 2026 (Exhibit 10). Data center REITs have rebounded in 2026 and appear well positioned to benefit from sustained hyperscaler demand, which should support further rent growth.
EXHIBIT 10
Data centers offer relatively low-risk exposure to the AI boom
Incremental global AI data center demand (Gigawatts)
At March 31, 2025. Source: PMP Strategy, NVIDIA GTC March 2026, IEA, JLL.
Forecasts are inherently limited. There is no guarantee that any market forecast will be realized.
Senior housing: Another record year of growth as 80+ population climbs
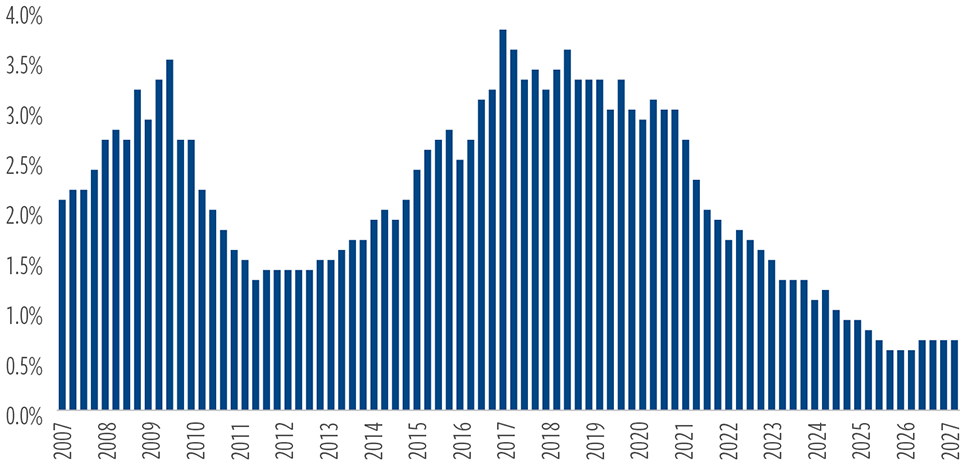
Demographic forecasts have long pointed to a “silver tsunami,” and the growth of the 80+ population is now fully underway. Following the recovery from pandemic-driven occupancy declines, senior housing is benefiting from a favorable supply/demand backdrop (Exhibit 11). These forces were well understood in 2025 and drove meaningful outperformance. Recent earnings from listed companies confirm that momentum is likely to persist, with less risk of the deceleration some investors had anticipated.
Listed senior housing illustrates a clear lead/lag relationship with the private market. Growing investor focus on the asset class should support valuations as capital pursues a limited opportunity set in 2026. Premiums to net asset values provide listed companies a lower cost of capital. However, an imbalance between capital and available deals in the private market is likely to push valuations higher in the near term—at least until new supply begins to increase toward the end of the decade.
EXHIBIT 11
Demographics and muted supply growth bode well for senior housing
Senior housing supply growth as % of inventory
At May 31, 2026. Source: Green Street.
Past performance is no guarantee of future results.
Medical office: A boutique sector offering stable counter-cyclical growth
Medical office buildings (MOB) are gaining momentum as a beneficiary of aging demographics. The 65+ age cohort composes 17% of the population but accounts for 37% of health care spending—a figure that should grow well above national consumer levels for years to come.
A parallel secular shift toward outpatient care further reinforces demand. Procedures performed in outpatient settings—often housed in MOBs—can reduce costs by an estimated 59%, according to recent studies. As the list of procedures eligible for outpatient delivery expands, so too should demand for the property type.
Fundamentals remain solid. National occupancy has reached post-pandemic highs, and new supply remains manageable and below long-term averages. Asset valuations, however, often depend on the quality and credit of the hospital systems they are associated with, creating a more partnership- oriented landlord/tenant relationship. This alignment tends to limit outsized rent growth but enhances income stability.
As a result, MOBs generate relatively predictable cash flows, supported by countercyclical demand drivers, making them a compelling diversifier in both listed and private portfolios.
Self storage: Waiting on stronger housing to spark a turnaround
Over the last 15 years, self storage has evolved from a niche property type— one often overlooked by institutional investors—into a highly attractive business characterized by low capital intensity and durable rent growth. This re-rating has been reflected in both listed and private market valuations.
More recently, the sector has faced two notable headwinds: elevated new supply leading into and during the pandemic, and a subdued housing market. Home sales, a key driver of demand, have remained near 30-year lows following the sharp rise in mortgage rates in 2022.
As a result, operating fundamentals have lagged broader real estate industry averages for the last four years. While 2026 may mark an inflection point, a sustained recovery in housing activity will be critical for a meaningful rebound in rent growth. Although policymakers have proposed measures to stimulate the housing market, a clear path to near-term improvement remains uncertain.
As the sector’s fundamentals stabilize, the listed market is likely to provide an early signal of improving sentiment.
Known unknowns lie ahead
Several impediments to commercial real estate performance should ease in 2026. But as last year and the start of this year showed, policy-driven volatility resulting from the current proactive administration is likely to persist.
Key areas to monitor include geopolitical tensions in Iran, questions around Fed independence and interest rates, the continued use of tariffs, the impact of AI on productivity and workforce composition, and the administration’s focus on housing affordability.
Despite the elevated headline risk, commercial real estate continues to offer investors a differentiated combination of attractive income and total return potential, supporting its role in diversified portfolio construction.
Resilient cash flows, limited new supply and recovering capital markets underpin a constructive outlook for real estate across listed and private investments.
ABOUT THE AUTHORS

Seth Laughlin, Senior Vice President, is Head of Real Estate Strategy & Research, responsible for identifying allocation opportunities in both listed and private real estate and related thematic and strategic research.
Index definitions / important disclosures
An investor cannot invest directly in an index, and index performance does not reflect the deduction of any fees, expenses or taxes.
Past performance is no guarantee of future results. There is no guarantee that any historical trend illustrated/referenced above will be repeated in the future, and there is no way to predict precisely when such a trend might begin. There is no guarantee that any market forecast set forth in this commentary will be realized. The views and opinions in the preceding commentary are as of the date of publication and are subject to change.
This material represents an assessment of the market environment at a specific point in time and should not be relied upon as investment advice, does not constitute a recommendation to buy or sell a security or other investment, and is not intended to predict or depict performance of any investment. This material is not being provided in a fiduciary capacity and is not intended to recommend any investment policy or investment strategy or take into account the specific objectives or circumstances of any investor. We consider the information in this presentation to be accurate, but we do not represent that it is complete or should be relied upon as the sole source of appropriateness for investment. Please consult with your investment, tax or legal professional regarding your individual circumstances prior to investing. The views and opinions expressed are not necessarily those of any broker/dealer or its affiliates. Nothing discussed or suggested should be construed as permission to supersede or circumvent any broker/dealer policies, procedures, rules or guidelines.
Risks of investing in real estate securities. The risks of investing in real estate securities are similar to those associated with direct investments in real estate, including falling property values due to increasing vacancies; declining rents resulting from economic, legal, political or technological developments; lack of liquidity; lack of availability of financing; limited diversification; sensitivity to certain economic factors, such as interest rate changes and market recessions; and changes in supply of or demand for similar properties in a given market. No representation or warranty is made as to the efficacy of any particular strategy or fund or the actual returns that may be achieved.
Risks of investing in private real estate. Private real estate investments are illiquid and susceptible to economic slowdowns or recessions and industry cycles, which could lead to financial losses and a decrease in revenues, net income and assets. Lack of liquidity in the private real estate market makes valuing underlying assets difficult. Appraisal values may vary substantially from a price at which an investment in real estate may actually be sold.
No representation or warranty is made as to the efficacy of any particular strategy or the actual returns that may be achieved.
Cohen & Steers Capital Management, Inc. (Cohen & Steers) is a U.S. registered investment advisory firm that provides investment management services to corporate retirement, public and union retirement plans, endowments, foundations and mutual funds. Cohen & Steers Asia Limited is authorized and regulated by the Securities and Futures Commission of Hong Kong (ALZ367). Cohen & Steers Japan Limited is a registered financial instruments operator (investment advisory and agency business and discretionary investment management business with the Financial Services Agency of Japan and the Kanto Local Finance Bureau No. 3157) and is a member of the Japan Investment Advisers Association.
Cohen & Steers UK Limited is authorized and regulated by the Financial Conduct Authority (FRN458459). Cohen & Steers Ireland Limited is regulated by the Central Bank of Ireland (No.C188319). Cohen & Steers Singapore Private Limited
is a private company limited by shares in the Republic of Singapore.
For recipients in the Middle East: This document is for informational purposes only. It does not constitute or form part of any marketing initiative or any offer to issue or sell (or any solicitation of any offer to subscribe or purchase) any products, strategies or other services, nor shall it or the fact of its distribution form the basis of, or be relied on in connection with, any contract resulting therefrom. In the event that the recipient of this document wishes to receive further information with regard to any products, strategies or other services, it shall specifically request the same in writing from us.
All investing involves risk. Loss of principal is possible.