Return expectations for the next 10 years are shifting as enduring structural forces reshape markets, demanding that investors reevaluate strategic portfolio allocations.
KEY TAKEAWAYS
- Today’s investing landscape continues to reflect a macroeconomic regime very different from the one investors grew accustomed to post the global financial crisis.
- The forces behind our long-term assumptions—normalizing interest rates in recent years, elevated geopolitical uncertainty, physical resource constraints and the fading of the disinflationary tailwinds of the 1990–2019 era—are firmly in place.
- The case for rotation away from narrow U.S. equity leadership and toward more attractively valued, more diversifying assets is stronger today than at any time since the early 2000s.
Today’s investing landscape continues to reflect a macroeconomic regime very different from the one investors grew accustomed to post the global financial crisis. The shifts set in motion by pandemic-era imbalances, geopolitics, supply chain realignment, and a major pivot in monetary policy have proven enduring rather than cyclical. The past year brought more clarity, but it also reaffirmed a central reality: The “old normal” of near zero interest rates, muted inflation volatility and persistently low yields is simply not returning in the foreseeable future. Instead, we are operating in a world of higher-trend inflation, more frequent macro swings, and a more balanced distribution of returns across asset classes, compared with the long expansion post the global financial crisis.
Our outlook is constructive, not complacent: enduring macro shifts favor disciplined, forward‑looking portfolios over reliance on past winners.
Our annual Capital Market Assumptions (CMA) lay out the outlook for return expectations across markets for the next decade. What has changed since last year is the composition, not the direction, of the regime shift. Growth now rests on a firmer foundation, supported by gradually improving productivity—especially in technology-intensive sectors—and sustained investment in infrastructure and energy systems. Inflation has come down meaningfully from its highs but continues to exhibit the stickiness we anticipated in previous CMAs, driven by structural forces such as labor scarcity, years of commodity underinvestment, and the shift toward deglobalization.
Equally important, the forces behind our long-term assumptions— normalizing interest rates in recent years, elevated geopolitical uncertainty, physical resource constraints and the fading of the disinflationary
tailwinds of the 1990–2019 era—remain firmly in place. Real yields remain meaningfully positive, inflation risks remain asymmetric to the upside, and we expect rotation of market leadership in coming years.
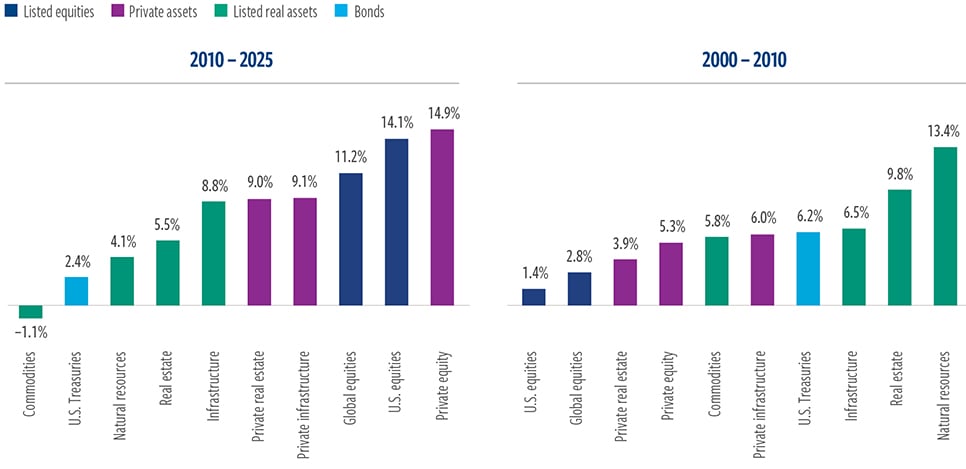
As we have written in the past, investors have demonstrated a tendency to chase past winners. We call this behavior the FOMO trap—the fear of missing out, which leads investors to chase what has worked in the most recent cycle. However, the reality of market cycles suggests caution. Indeed, market leadership changes during different regimes. Exhibit 1 shows this clearly. In the early 2000s, real assets and bonds were clear winners. Over the last 15 years, equities and private assets dominated market leadership.
EXHIBIT 1
Beware of assuming recent leadership will persist
Annualized total returns
As of December 31, 2025. Source: MSCI, Barclays, Bloomberg, Dow Jones, FTSE, S&P, LSEG Datastream, Cohen & Steers.
Past performance is no guarantee of future results. The information presented above does not represent the performance of any fund or other account managed or serviced by Cohen & Steers, and there is no guarantee that investors will experience the type of performance listed above. Private assets performance as of September 30, 2025, due to data availability.
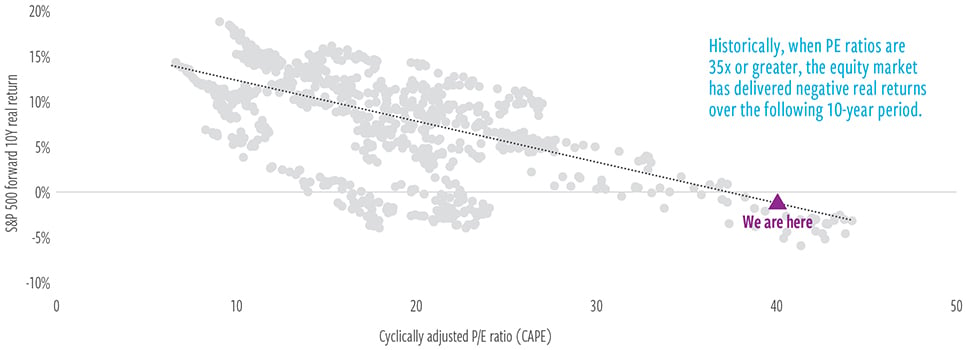
As a result of the robust performance of U.S. equities, valuations are now at near historical extremes (Exhibit 2). Yet the underlying reality is more nuanced: While technology-led growth is real, the cost of capital has structurally risen, input prices remain firm, and margins are now more likely to compress than expand.
This is why the case for rotation away from narrow U.S. equity leadership and toward more attractively valued, more diversifying assets is stronger today than at any time since the early 2000s. Real assets in particular stand out. Their combination of appealing valuations, strong inflation linkage, healthy fundamentals in supply-constrained segments, and positive correlation with the themes of the new regime positions them for a larger role in long-term portfolios. Infrastructure and natural resource equities benefit from multi-year investment cycles and supply discipline; commodities have experienced years of underinvestment; and listed real estate, having reset meaningfully, offers more balanced return prospects with improved income yields.
EXHIBIT 2
The growth engine of the 60/40 portfolio appears poised to stall
S&P 500 CAPE vs. forward 10-year real return
As of December 31, 2025. Source: Research by Robert J. Shiller.
Past performance is no guarantee of future results. The information presented above does not represent the performance of any fund or other account managed or serviced by Cohen & Steers, and there is no guarantee that investors will experience the type of performance listed above. The cyclically adjusted price-to-earnings (CAPE) ratio is measured as the price of the S&P 500 Index divided by its 10-year moving average of earnings, adjusted for inflation.
Our outlook for the next 10 years is constructive, not complacent. Risks remain: AI-driven productivity could disappoint, or it could lead to structurally higher unemployment. Inflation could reaccelerate on renewed supply shocks. Geopolitical events may further disrupt global trade flows. Valuations across equities or private markets may adjust faster than expected. The bond market could also reprice the long-term neutral rate higher, or credit spreads could widen abruptly after a prolonged period of tightness.
Still, the macro backdrop and market setup provide the strongest foundation for rotation in more than a decade. With forward-looking returns shaped increasingly by starting valuations, cash flows and structural sensitivities— not momentum or index concentration—the next decade is likely to diverge meaningfully from the last. Investors may not worry about missing another surge in last decade’s leaders, but we see a greater risk: missing the broadening opportunity set now emerging.
The next decade is likely to diverge meaningfully from the last, as starting valuations, cash flows and structural forces— not index concentration or momentum—drive returns.
Macroeconomics
We expect the global economy to deliver moderate but stable growth over the next decade, with the U.S. averaging 2.1% real GDP growth and global growth trending at 3.6% annually. We expect 1.8% trend productivity growth (up 60 basis points from last year’s publication), partly linked to AI diffusion and
ongoing investment in digital and physical infrastructure—offset by worsening demographics (with estimated labor force growth down 40 basis points from last year to 0.3% annually) and episodic supply frictions.
Consumer inflation is expected to average 3.0% annually in the U.S., below recent peaks but well above the 1.6% experienced in the last cycle and significantly higher than the Federal Reserve’s long-term target. This elevated inflation reflects structural tightness in labor and materials, a more fragmented global trading system and geopolitical friction.
Fixed income
Interest rates are likely to remain higher than in the prior decade, with long term yields reflecting positive real rates and firmer inflation expectations. While absolute yields drifted lower during 2025, the long-term equilibrium for interest rates has reset meaningfully higher, offering investors a more attractive long-term fixed income return profile relative to the last decade.
We expect U.S. government bonds to deliver solid, if unspectacular, nominal returns of 4.2% annually, down from our prior estimate of 4.6%. Credit sectors will benefit from healthy economic and corporate fundamentals. However, today’s tight spreads and expected greater cyclical volatility suggest returns will be income driven, with little potential capital appreciation.
Equities
U.S. equity returns, at 5.8% annually for the next 10 years, remain constrained by elevated valuations, slower-trend growth, higher input costs and a structurally higher cost of capital. We see better opportunities in developed non‑U.S. equities, with returns holding steady from the prior forecast at 7.0%, as valuations are more compelling and earnings growth has room to normalize.
Emerging markets remain a selective opportunity, with fundamentals varying widely across regions and sectors. Overall, emerging market equity returns are expected to be 6.3%, similar to last year’s projection but below their long term historical average given the healthy gains of the last decade.
Real assets
We do not want to put too much weight on the importance of any one year, but 2025 was a reminder that real assets can perform well even when other markets show strong returns. Most real assets categories were up more than 10% in 2025, and they stand out as one of the most compelling long-term opportunities today.
We expect natural resource equities to lead with annual returns of 8.5%. Infrastructure is projected to return 7.9%, real estate 7.8 and commodities 5.9%, all supported by structural scarcity, inflation sensitivity and sustained investment needs. Valuations are attractive, fundamentals remain strong, and correlations with traditional stocks and bonds continue to offer diversification benefits.
Fixed income
Fixed income enters 2026 with one of its strongest starting points in more than 15 years. After a prolonged period during which yields were suppressed by central bank accommodation, the reset in monetary policy has reintroduced meaningful income into the asset class. We expect U.S. Treasuries to deliver mid‑single-digit annualized returns over the next decade, supported by a combination of higher real yields and more stable inflation expectations. Although yields have declined somewhat from their 2023–2024 highs, long-term fair value remains above pre‑pandemic norms, reflecting a neutral policy rate that is structurally higher than in the last cycle.
4.2% Expected 10-year annualized returns for U.S. Treasuries
Corporate credit continues to benefit from solid balance sheets, disciplined issuance and healthy interest coverage. The primary challenge across credit markets is valuation: Spreads remain near cyclical lows, suggesting limited room for capital appreciation and greater sensitivity to macro shocks.
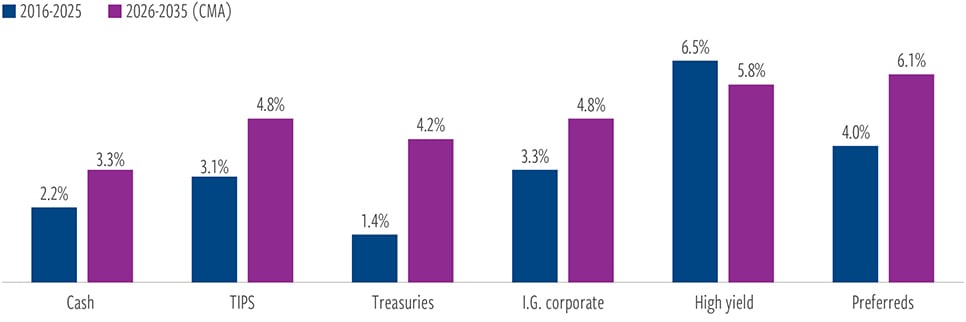
Investment-grade credit is expected to generate steady, income‑driven returns of 4.8%, slightly less than last year’s projection. High yield offers the potential to return an average of 5.8% annually, moderately below our prior forecast due to tight spreads and a projected modest increase in default risk.
We believe preferred securities will be the top-performing fixed income category in the coming decade, given the asset class’s high yields, high quality and relatively low default rates, consistent with historical trends. Our forecasted return for preferreds remains unchanged from last year at 6.1% annually.
EXHIBIT 3
Yield drives the outlook for fixed income as tight spreads limit upside
Expected annual returns vs. prior-decade annual returns
At December 31, 2025. Source: LSEG Datastream, Bloomberg, Cohen & Steers.
Past performance is no guarantee of future results. Forecasts are inherently limited. There is no guarantee that any market forecast will be realized.
Equities
Equity markets have delivered strong returns for more than a decade, powered largely by U.S. companies (and, in particular, by a narrow subset of mega‑cap technology names). However, the factors underpinning that outperformance— low interest rates, benign inflation, expanding profit margins and valuation multiple expansion, among other things—are unlikely to persist at the same scale. With interest rates structurally higher and inflation more variable, the path for earnings growth becomes more challenging.
5.8% Expected 10-year annualized returns for U.S. equities
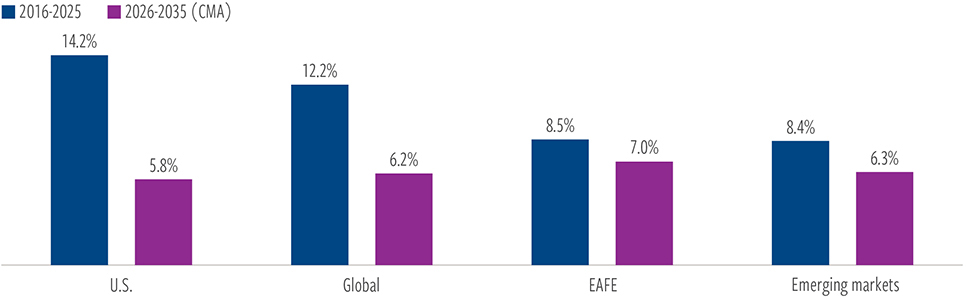
We expect U.S. equity returns to moderate toward their long-term averages, with headwinds emerging from compressed margins, rising labor costs and an elevated cost of capital. Our 10-year forecast of 5.8% annualized returns is unchanged from last year’s CMA projection. Valuations remain a central concern: While earnings growth may continue, starting multiples are likely to compress somewhat. Market concentration adds another layer of risk, as leadership remains heavily dependent on a small number of firms whose valuations already price in substantial future productivity gains.
Opportunities appear more balanced outside the U.S., where valuations are more attractive and earnings cycles less extended. Developed international markets are expected to generate average annual returns of 7.0%, in line with last year’s forecast, benefiting from lower starting multiples and sector exposures that are more closely aligned with the themes of the new regime, such as industrials, materials and financials. Emerging markets remain a selective opportunity, with the need for careful differentiation across countries and industries; our expectations for average annual growth remain unchanged at 6.3%.
EXHIBIT 4
The U.S. is poised for below-average returns given P/E multiple compression
Expected annual returns vs. prior-decade annual returns
At December 31, 2025. Source: LSEG Datastream, Bloomberg, Cohen & Steers.
Past performance is no guarantee of future results. Forecasts are inherently limited. There is no guarantee that any market forecast will be realized.
Real assets
Real assets remain one of the most compelling investment opportunities in the decade ahead, supported by structural macroeconomic tailwinds, attractive valuations and strong income characteristics. In an environment defined by inflation variability, scarcity of physical inputs and elevated geopolitical risk, real assets offer diversification benefits that are difficult to replicate.
Listed real estate has reset, resulting in higher yields, improved cap rate spreads and improved assumptions about long-term growth. Low supply additions in recent years, stemming from higher rates and tighter credit conditions are now giving way to better pricing power. Our 7.8% annualized forecast is unchanged from the 2025 CMA.
7.8% Expected 10-year annualized returns for U.S REITs
The infrastructure outlook has likewise improved, rising to 7.9% from 7.6% annually on average. The asset class is expected to benefit from multi‑year public and private investment cycles focused on AI and digital connectivity, transportation and energy systems. Infrastructure assets typically possess pricing power linked to inflation and long‑duration, contracted cash flows.
Natural resource equities are projected to gain 8.5% annually on average, up slightly from our year-ago projection. That forecast is shaped by a supply‑constrained environment where capital discipline, years of
underinvestment, and growing demand for metals and energy inputs underpin favorable long-term fundamentals.
EXHIBIT 5
Structural tailwinds support competitive long term returns for real assets
Expected average annual returns vs. prior-decade annual returns
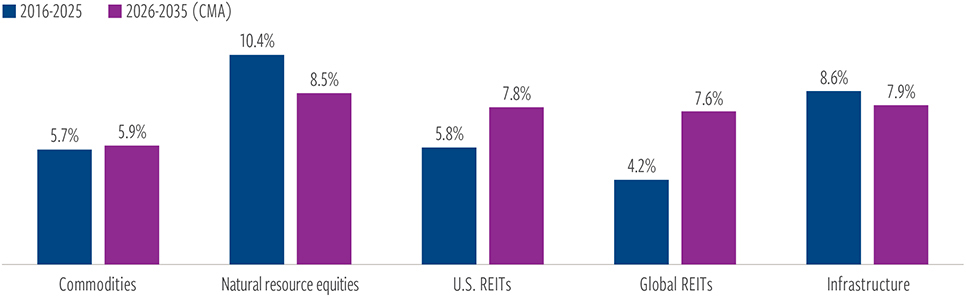
At December 31, 2025. Source: LSEG Datastream, Bloomberg, Cohen & Steers.
Past performance is no guarantee of future results. Forecasts are inherently limited. There is no guarantee that any market forecast will be realized.
Commodities are starting from relatively unattractive valuations, and, consequently, their projected return of 5.9% annually for the next decade is the lowest among the core real assets categories. Nevertheless, commodities offer asymmetric upside potential in a world where supply constraints are structural and demand is supported by secular forces, including electrification, reindustrialization, and energy transition policies.
Exhibit 6 offers a valuation comparison between real assets and broader equities. As you can see, large-cap equities trade at extreme levels by a variety of metrics today, whereas most real assets are much more reasonably priced. And, we would argue, natural resource equities valuations do not yet reflect the strong growth we envision in the decade ahead.
EXHIBIT 6
Real assets valuations appear significantly more attractive than those of broad equities
Valuation percentile vs. the past 10 years
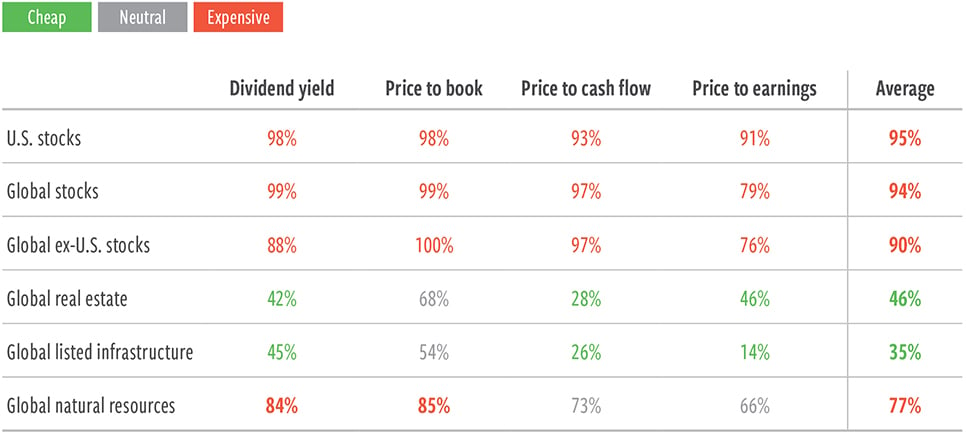
At December 31, 2025. Source: Haver, UBS, Cohen & Steers.
Long-term median measured since 1995. U.S. equities: S&P 500 Total Return Index. Global equities: MSCI ACWI Total Return Index. EAFE: MSCI EAFE Total Return Index. Global REITs: FTSE EPRA Nareit Developed Real Estate Index. Global listed infrastructure: UBS Global 50/50 Infrastructure & Utilities Index (net) through March 31, 2015, and the FTSE Global Core Infrastructure 50/50 Net Tax Index for periods thereafter. Natural resource equities: S&P Global Natural Resource Equities Index
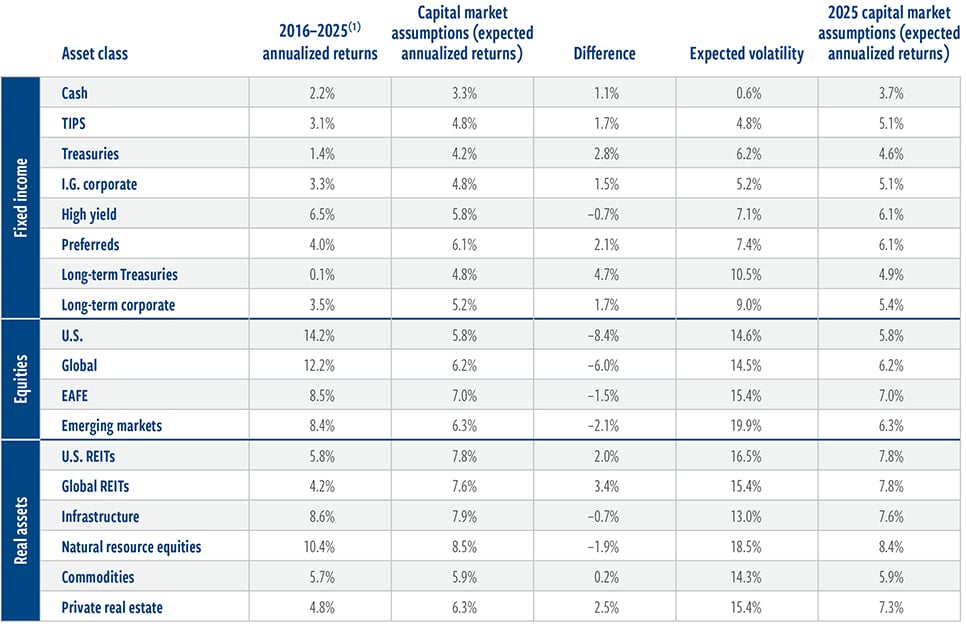
Full 10-year capital market assumptions detail
Expected average annual returns vs. prior-decade annual returns
Expected equity market return decomposition
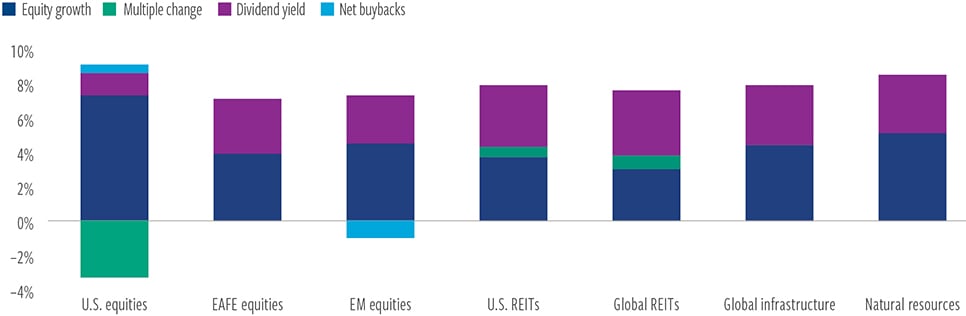
Past performance is no guarantee of future results. Forecasts are inherently limited. There is no guarantee that any market forecast will be realized. (1) 2016–2025 performance (01/01/2016–12/31/2025) represented by the following: Fixed income: Cash: Bloomberg U.S. Long Government/Credit Index. TIPS: U.S. Treasury Inflation Notes Index. Treasuries: Bloomberg U.S. Treasury 7-10 Year Index. Investment-grade corporate bonds: Bloomberg U.S. Corporate Investment Grade Index. High-yield bonds: ICE BofA High Yield Master II Index. Preferred securities: ICE BofA Fixed Rate Preferred Securities Index. Long-term Treasuries: Bloomberg U.S. Treasury Long Bond Index. Long-term corporates: Bloomberg Long U.S. Corporate Bond Index. U.S. equities: S&P 500 Total Return Index. Global equities: MSCI ACWI Total Return Index. EAFE: MSCI EAFE Total Return Index. Emerging markets: MSCI Emerging Markets Total Return Index. Real assets: U.S. REITs: FTSE Nareit All Equity REITs Index. Global REITs: FTSE EPRA Nareit Developed Real Estate Index. Global listed infrastructure: UBS Global 50/50 Infrastructure & Utilities Index (net) through March 31, 2015, and the FTSE Global Core Infrastructure 50/50 Net Tax Index for periods thereafter. Natural resource equities: S&P Global Natural Resource Equities Index. Commodities: Bloomberg Commodity Total Return Index. Private real estate: NCREIF ODCE Index. Volatility is represented by standard deviation, which is a statistical measure of the historical volatility of returns; the higher the number, the greater the risk.
Expected asset class correlations in detail
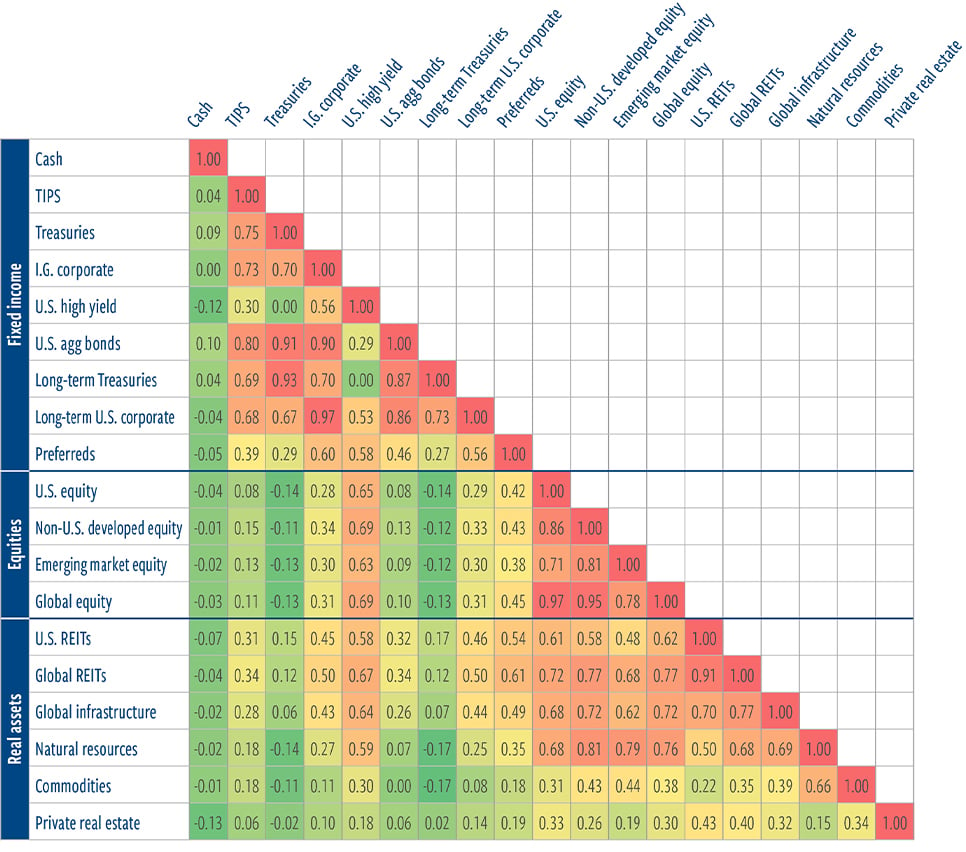
At December 31, 2025. Source: Cohen & Steers. Forecasts are inherently limited. There is no guarantee that any market forecast will be realized. Correlation coefficients are based on monthly data and measure the degree to which the returns of two assets move together. Correlations vary from -1.0 (perfect inverse relationship) to 1.0 (perfect synchronization).
IMPORTANT: The capital market assumptions regarding the likelihood of various investment outcomes are hypothetical in nature, do not reflect actual investment results, and are not guarantees of future results. The expectations and other information are for educational and illustrative purposes only. Hypothetical performance has inherent risks and limitations, and prospective investors should not place undue reliance on any such information. Because of Cohen & Steers’ investment focus on real assets, Cohen & Steers will benefit from increased interest in these asset classes, and you should keep this conflict in mind when evaluating the capital market assumptions. Other investments may have characteristics similar or superior to real assets. Additionally, Cohen & Steers may make investment decisions that are inconsistent with the capital market assumptions or any views expressed herein.
Cohen & Steers may also develop and publish material that is independent of, and different than, the capital market assumptions or any views expressed herein.
The intent of the capital market assumptions is not to predict or project future returns of any investment, asset class or portfolio. Instead, the purpose of the capital market assumptions is to express Cohen & Steers’ view of expected general asset class returns of the period shown, which may be incorrect, potentially materially so, and are subject to change without notice.
By receiving this communication, you agree with and acknowledge the limitations of the capital market assumptions, the associated conflicts and the restrictions on use described herein.
The information presented is provided as educational and is not intended to be (and should not be) relied upon as a recommendation to invest in any specific security or asset class or to adopt any investment strategy, or as the primary basis for any investment decisions. Prior to making a decision to invest in any security or asset class, you should consult with your financial professional to determine whether the decision is appropriate for you. Return, yield and volatility expectations are based on Cohen & Steers’ analysis, are not a guarantee of future performance, and do not represent the past or projected performance of any fund, investor or other account managed by Cohen & Steers.
The assumptions used to form the basis for the information presented are as of the date shown and are subject to change. Projected returns, yield, volatility and liquidity are subject to many factors that are uncertain and outside the control of Cohen & Steers, and analysis may be subject to error. Projected outcomes depend on economic events, which (even if they occur) could result in outcomes that could be materially higher or lower than expected. The performance expectations displayed represent the
midpoint possible expectations within a broader range of possible outcomes, some of which are negative. Actual outcomes could be materially lower than the central expectations. An investor cannot invest directly in an index, and index performance does not reflect the deduction of any fees, expenses or taxes.
Index comparisons have limitations, as volatility and other characteristics may differ from a particular investment. There can be no assurance that any trends or correlations shown herein will continue in the future.
The information presented is not being provided in a fiduciary capacity and does not account for the age, other investments, financial situation, tax status, investment objectives, investment experience, investment time horizon, liquidity needs or risk tolerance of any investor. We believe the information to be accurate, but we do not represent that it is complete or should be relied upon as the sole source of appropriateness for determining any investment strategy. Cohen & Steers does not provide investment,
tax or legal advice and will not advise you on your investment decisions. Investors should consult with their investment, tax or legal professional regarding their individual circumstances prior to making any investment decisions.
Criteria and methodology
Inputs to these expectations include return, volatility and correlation across asset classes. Assumptions are generally not updated on a real-time basis; therefore, results may vary with each use and over time. All such expectations are subject to change. Yields on all markets are based on levels derived at year-end 2024.
Expectations for returns are driven by a range of factors. Within fixed income, forecasts for interest rates are determined at various maturities based on economic growth, inflation, and policy expectations, as well as factors such as the shape of the yield curve, the expected level of real interest rates and inflation breakevens, and credit spreads. These interest rates are used to compute expectations for total returns, accounting for the starting point of bond yields, capital gain/loss based on assumption of benchmark duration, and yield. Treasury bond returns are based on expectations for the level of inflation, the path of future short-term rates, and an expectation for the slope of the yield curve. Credit returns, including corporate, high yield and preferreds, are based on expectations for fair value spread levels along with adjustments for historical downgrade and default risk through an economic cycle.
For equities, including listed real assets, various factors contribute to total return expectations. Expectations are based on estimates for earnings growth and fair value multiples. Earnings growth expectations are driven by expected profitability and payout ratios, while valuation multiples are based on expected interest rates, risk premiums and growth rates. Changes in valuations are driven by forecasts of interest rates, risk premiums, growth and profitability. Dividend yield also contributes to total return.
For commodities, we forecast investable returns by coming up with expectations on index-level spot returns, roll returns and collateral returns. Spot returns are a function of inflation and expectations for supply/demand/inventory balances, roll returns are a function of the typical shape of the commodity futures curve, and collateral returns are a function of our forecast for short-term interest rates. Volatility assumptions are driven by historical experience as well as expectations for changes related to growth, inflation, policy, etc. Volatility for private real estate is adjusted (per academic work by Geltner) to more accurately reflect economic volatility, correcting for the autocorrelation/smoothing that exists in private RE returns. Correlations reflect historical observations. Forward looking volatility and correlation assumptions are based on historical outcomes.
Volatility data use the full available data history for each respective market. Correlation data use a common starting point. Future economic and market conditions could result in different experiences in coming years.
Due to the illiquid nature of private real estate, private real estate returns generally exhibit a pattern that understates the level of volatility that would be realized if assets were valued more frequently. We used a statistical adjustment (Geltner, David; 1993; “Estimating Market Values from Appraised Values without Assuming an Efficient Market”) to adjust for the first-order autocorrelation in the appraisal-based private real estate return series to arrive at an estimate that more accurately reflects the true volatility of private real estate returns for the time periods shown. This adjustment is also applied to calculations of private real estate correlation to other asset classes. Estimates are inherently uncertain and may not reflect actual outcomes. Utilizing different factors or assumptions in conducting the statistical analysis may result in materially different estimates than those shown. Investing in private real estate involves substantial risk, including the entire loss of an investment.
Certain inputs into the capital market assumptions have been obtained from sources that Cohen & Steers believes to be reliable as of the date presented; however, Cohen & Steers cannot guarantee the accuracy of such content, assure its completeness, or warrant that such information will not be changed. The content herein and inputs into the capital market assumptions are current as of the date of publication (or such earlier date as referenced herein) and are subject to change without notice. Cohen & Steers does not make any express or implied warranties or representations as to the inputs into the capital market assumptions or the completeness or accuracy of its results.
Risks of investing:
Risks of equity investing. Common stocks are subject to special risks. Although common stocks have historically generated higher average returns than fixed income securities over the long term, common stocks also have experienced significantly more volatility in returns. Common stocks may be more susceptible to adverse changes in market value due to issuer-specific events or general movements in the equities markets. Common stock prices fluctuate for many reasons, including changes to investors’ perceptions of the financial condition of an issuer or the general condition of the relevant stock market, as well as the occurrence of political or economic events affecting issuers.
Risks of investing in fixed income securities. Fixed income securities are subject to the ability of an issuer to make timely principal and interest payments, changes in interest rates, the creditworthiness of the issuer, and general market liquidity. In a rising–interest rate environment, bond prices may fall, and this may result in periods of volatility and increased portfolio redemptions. In a declining–interest rate environment, fixed income securities may generate less income. Longer-term securities may be more sensitive to interest rate changes. High-yield securities (“junk bonds”) are lower-rated securities that may have a higher degree of credit and liquidity risk. U.S. Treasury securities are backed by the full faith and credit of the U.S. government as to payment of principal and interest.
Risks of investing in real estate securities. The risks of investing in real estate securities are similar to those associated with direct investments in real estate, including falling property values due to increasing vacancies or declining rents resulting from economic, legal, political or technological developments; lack of liquidity; limited diversification; and sensitivity to certain economic factors such as interest rate changes and market recessions.
Risks of investing in global infrastructure securities. Infrastructure issuers may be subject to regulation by various governmental authorities and may also be affected by governmental regulation of rates charged to customers; operational or other mishaps; tariffs; and changes in tax laws, regulatory policies and accounting standards.
Risks of investing in foreign securities. Foreign securities involve special risks, including currency fluctuations, lower liquidity, political and economic uncertainties, and differences in accounting standards. Some international securities may represent small and medium-sized companies, which may be more susceptible to price volatility and may be less liquid than larger companies.
Risks of investing in the energy sector. A downturn in the energy sector of the economy could have a larger impact on a strategy concentrated in the energy sector than on a strategy that does not concentrate in the sector. In addition, there are several specific risks associated with investments in the energy sector, including commodity price risk, depletion risk, supply and demand risk, interest rate transaction risk, affiliated party risk, limited partner risk, and risks of subordinated MLP units. MLPs that invest in the energy industry are highly volatile due to significant fluctuation in the prices of energy commodities as well as political and regulatory developments.
Risks of investing in commodities. An investment in commodity-linked derivative instruments may be subject to greater volatility than investments in traditional securities, particularly if the instruments involve leverage. The value of commodity-linked derivative instruments may be affected by changes in overall market movements, commodity index volatility, changes in interest rates, or factors affecting a particular industry or commodity, such as drought, floods, weather, livestock disease, embargoes, tariffs and
international economic, political and regulatory developments. The use of derivatives presents risks different from, and possibly greater than, the risks associated with investing directly in traditional securities. Among the risks presented are market risk, credit risk, counterparty risk, leverage risk and liquidity risk. The use of derivatives can lead to losses because of adverse movements in the price or value of the underlying asset, index or rate, which may be magnified by certain features of the derivatives. No representation or warranty is made as to the efficacy of any particular strategy or fund or the actual returns that may be achieved. Futures trading is volatile and highly leveraged, and it may be illiquid. Investments in commodity futures contracts and options on commodity futures contracts have a high degree of price variability and are subject to rapid and substantial price changes. Such investments could incur significant losses. There can be no assurance that the options strategy will be successful. The use of options on commodity futures contracts is to enhance risk-adjusted total returns. The use of options, however, may not provide any, or may provide only partial, protection from market declines. The return performance of the commodity futures contracts may not parallel the performance of the commodities or indexes that serve as the basis for the options it buys or sells; this basis risk may reduce overall returns.
Risks of investing in natural resource equities. The market value of securities of natural resource companies may be affected by numerous factors, including events occurring in nature, inflationary pressures and international politics. If a strategy invests significantly in natural resource companies, there is the risk that the strategy will perform poorly during a downturn in the natural resource sector.
Risks of investing in preferred securities. Investing in any market exposes investors to risks. In general, the risks of investing in preferred securities are similar to those of investing in bonds, including credit risk and interest rate risk. As nearly all preferred securities have issuer call options, call risk and reinvestment risk are also important considerations. In addition, investors face equity-like risks, such as deferral or omission of distributions, subordination to bonds and other more senior debt, and higher corporate governance risks with limited voting rights. Risks associated with preferred securities differ from risks inherent with other investments. In particular, in the event of bankruptcy, a company’s preferred securities are senior to common stock but subordinated to all other types of corporate debt. It is important to note that corporate bonds sit higher in the capital structure than preferred securities and therefore, in the event of bankruptcy, will be senior to the preferred securities. Municipal bonds are issued and backed by state and local governments and their agencies, and the interest from municipal securities is often free from both state and local income taxes. Treasury securities are issued by the U.S. government and are generally considered the safest of all bonds since they are backed by the full faith and credit of the U.S. government as to timely payment of principal and interest.
Preferred securities may be rated below investment grade or may be unrated. Below-investment-grade securities or equivalent unrated securities generally involve greater volatility of price and risk of loss of income and principal, and they may be more susceptible to real or perceived adverse economic and competitive industry conditions than higher-grade securities.
Cohen & Steers Capital Management, Inc. (Cohen & Steers) is a U.S. registered investment advisory firm that provides investment management services to corporate retirement, public and union retirement plans, endowments, foundations and mutual funds. Cohen & Steers U.K. Ltd. is authorized and regulated by the Financial Conduct Authority of the United Kingdom (FRN 458459). Cohen & Steers Asia Ltd. is authorized and registered with the Hong Kong Securities and Futures Commission (ALZ367). Cohen & Steers Japan Ltd. is a registered financial instruments operator (investment advisory and agency business and discretionary investment management business with the Financial Services Agency of Japan and the Kanto Local Finance Bureau No. 3157) and is a member of the Japan Investment Advisers Association. Cohen & Steers Ireland Ltd. is regulated by the Central Bank of Ireland (No.C188319). Cohen & Steers Singapore Private Limited is a private company limited by shares in the Republic of Singapore. Cohen & Steers U.S. registered open-end funds are distributed by Cohen & Steers Securities, LLC, and are only available to U.S. residents.